Monitoring 101 for Data Engineers: Metrics, Logs, Traces If your pipeline breaks at 3 a.m. and the only signal you…
Read More
Monitoring 101 for Data Engineers: Metrics, Logs, Traces If your pipeline breaks at 3 a.m. and the only signal you…
Read More
Structured Logging 101 for Python & Kubernetes How to stop grepping random strings in production at 2 a.m. Introduction: Why…
Read More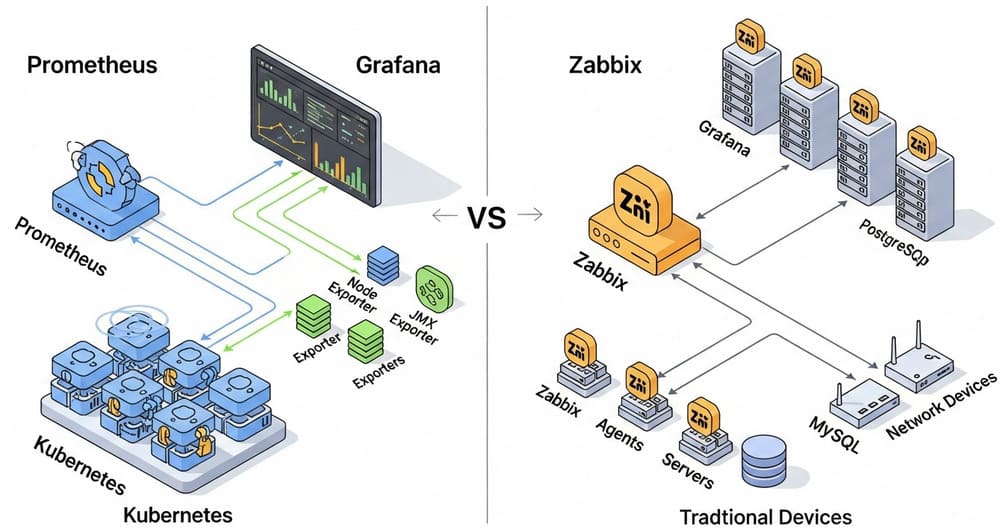
Prometheus vs Zabbix for Data Platforms: How to Choose Your Monitoring Stack If your data platform goes down at 3…
Read More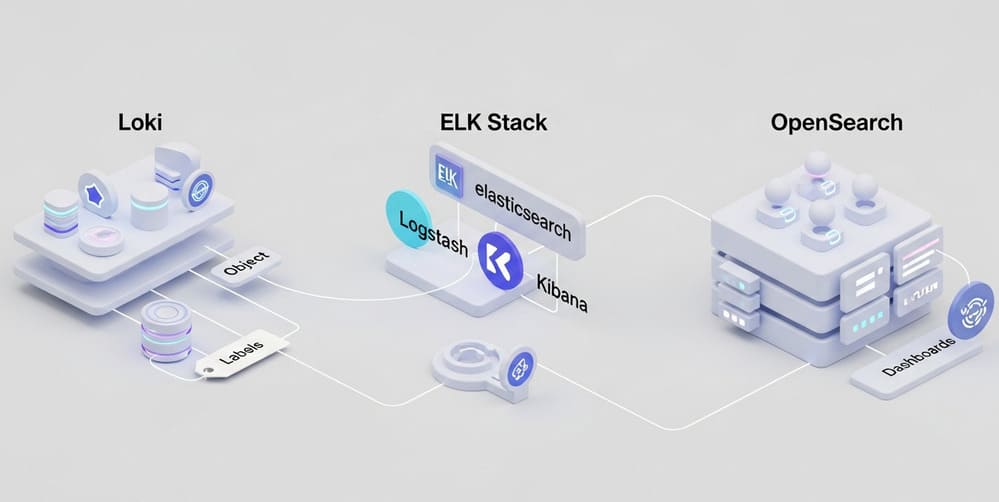
Loki vs ELK vs OpenSearch: How to Choose a Production Logging Stack (Without Burning Your Budget) If your logs are…
Read More
Designing SLIs and SLOs for Data Pipelines: A Practical Guide for Data Engineers If your data platform “looks fine” in…
Read More
Query Plans that Don’t Lie: Building a Performance Review with pg_stat_statements Hook: Your app got slower after the last release,…
Read More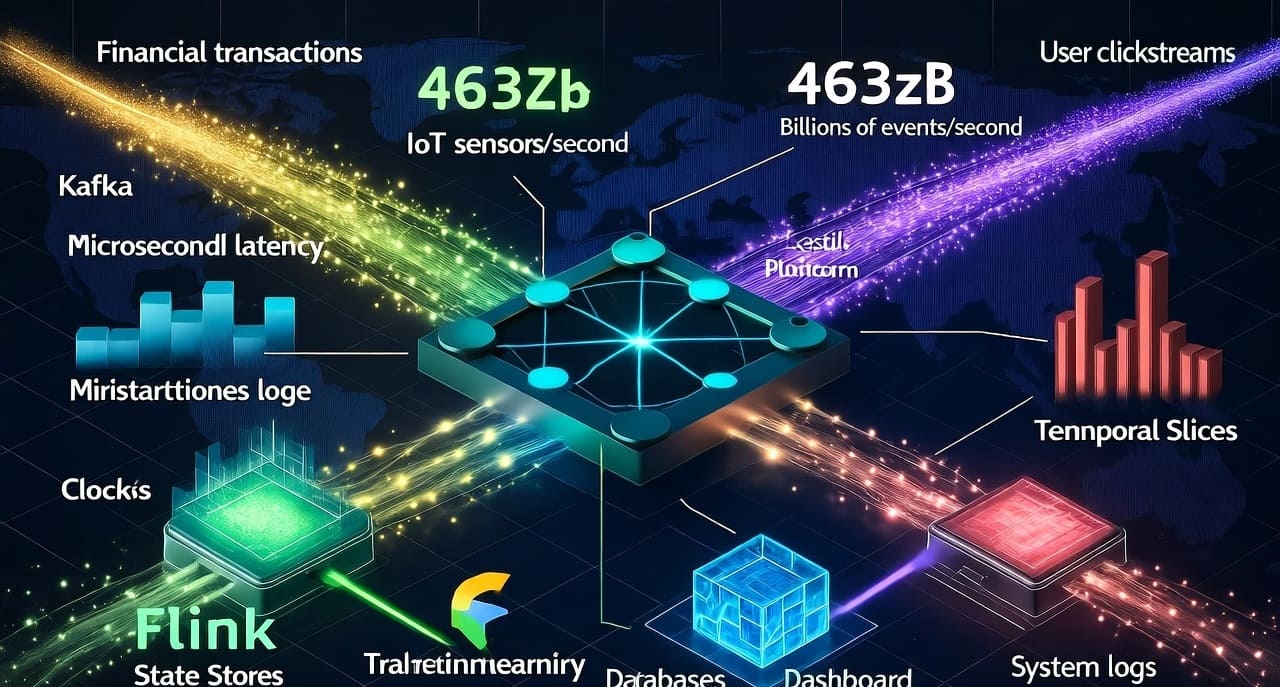
Introduction: The 463 Zettabyte Reality Every second, millions of IoT sensors transmit temperature readings, thousands of financial transactions execute across…
Read MoreAlert Fatigue in DevOps: How to Design Monitoring Alerts People Don’t Ignore If every on-call shift feels like babysitting a…
Read MorePrometheus for Data Engineers: From Metrics to SLOs (Without Losing Your Mind) Imagine this: your pipeline latency quietly doubles overnight.…
Read More
