Loki vs ELK vs OpenSearch: How to Choose a Production Logging Stack (Without Burning Your Budget)
If your logs are already blowing up S3 bills and Kibana dashboards take ages to load, you’re not alone. Modern systems spit out obscene volumes of logs — containers, sidecars, Lambdas, gateways, you name it. The wrong logging stack will quietly drain money, hide real incidents, and turn every P1 into “grep roulette”.
This article walks through Loki, ELK, and OpenSearch from a practical production perspective: cost, scaling, query patterns, cloud alignment, and operational pain.
1. The Three Stacks in One Sentence Each
- Loki – Log aggregation that indexes only labels, stores log bodies cheaply in object storage. Perfect for Kubernetes + Prometheus/Grafana shops, extremely cost-efficient. (DeepWiki)
- ELK (Elasticsearch + Logstash + Kibana + Beats) – The classic full-text log analytics stack; powerful search & dashboards, but heavy and expensive to run at scale. (elastic.co)
- OpenSearch (+ OpenSearch Dashboards) – Community-driven fork of Elasticsearch 7.10, still Lucene-based, similar architecture, with open-source licensing and strong AWS alignment. (Netdata)
If you remember nothing else:
Loki = cheap & Kubernetes-native, ELK = rich search but heavy, OpenSearch = “open ELK engine”, AWS-friendly.
2. Architectures at a Glance
2.1 Loki: Labels, Chunks, and Object Storage
Loki is designed to be Prometheus for logs: it treats logs like time series.
Key ideas: (DeepWiki)
- Only labels (metadata) are indexed (e.g.,
namespace,pod,app,env). - Log lines are stored in compressed chunks in object storage (S3, GCS, etc.).
- Query flow:
- Find streams by label filters in the index.
- Pull relevant chunks from object storage.
- Scan/filter log text on the fly using LogQL. (Grafana Labs)
Implication:
- Storage is cheap (object storage) and scales horizontally.
- But bad label design can destroy performance (high-cardinality labels = 🔥).
2.2 ELK: Full-Text Search Engine for Logs
ELK wraps logs around Elasticsearch, a Lucene-based search/analytics engine. (Logz.io)
Typical components:
- Beats/Filebeat/FluentBit – Ship logs.
- Logstash – Parse, enrich, transform.
- Elasticsearch – Store logs as documents, index fields & content.
- Kibana – Dashboards, queries, alerting. (elastic.co)
Characteristics:
- Every log line is a document with indexed fields.
- Amazing for free-text search (“find this stack trace anywhere across 7 days”).
- Great for aggregations, visualizations, and SIEM/observability add-ons.
The flip side:
- Index storage is expensive.
- Cluster tuning (shards, replicas, ILM policies, hot/warm tiers) is non-trivial. (Markaicode)
2.3 OpenSearch: The Open, AWS-Friendly Elasticsearch Fork
OpenSearch is the community fork of Elasticsearch/Kibana from before the license change. It keeps the same mental model: cluster of nodes, indexes, shards, Lucene. (Netdata)
Key points:
- Open-source (Apache 2.0), backed heavily by AWS.
- Features are similar: full-text search, aggregations, dashboards, alerting, observability plugins.
- Often used via Amazon OpenSearch Service for managed clusters.
Realistically, if you know Elasticsearch, you’re 80–90% of the way to understanding OpenSearch.
3. Loki vs ELK vs OpenSearch – Comparison Table
Think like an SRE/Platform owner, not a tools fanboy. Here’s the decision cheat sheet:
| Dimension | Loki | ELK (Elastic Stack) | OpenSearch |
|---|---|---|---|
| Indexing model | Labels only | Full-text + structured fields | Full-text + structured fields |
| Storage backend | Object storage (chunks) | Local/remote disk for indices | Local/remote disk for indices |
| Primary strength | Cost, k8s-native, Prometheus synergy | Deep analytics, mature ecosystem | Open-source ELK-style engine, AWS ecosystem |
| Search style | Label-first, then scan logs | Arbitrary full-text + aggregations | Same as ELK (Lucene-based search) |
| Best for | Cloud-native metrics+logs correlation | Security/SIEM, complex investigations | Cloud (esp. AWS) log/search with open licensing |
| Operational overhead | Low–medium (label design is key) | Medium–high (shards, ILM, JVM tuning) | Medium–high (similar to ELK) |
| Cost at scale | Usually lowest | Usually highest | Between ELK & Loki; depends on infra |
Blunt truth:
If you’re all-in on Kubernetes + Prometheus, starting with ELK is usually overkill and a future cost bomb.
If you’re doing compliance/SIEM-style investigations, Loki alone is usually not enough.
4. Example Architectures & Configs
4.1 Loki + Promtail + Grafana (Kubernetes)
Flow:
Pods → stdout → Promtail DaemonSet → Loki → Grafana dashboards
Minimal promtail snippet for Kubernetes logs:
server:
  http_listen_port: 9080
  grpc_listen_port: 0

clients:
  - url: http://loki:3100/loki/api/v1/push

scrape_configs:
  - job_name: kubernetes-pods
    kubernetes_sd_configs:
      - role: pod
    pipeline_stages:
      - docker: {}
    relabel_configs:
      - source_labels: [__meta_kubernetes_pod_label_app]
        target_label: app
      - source_labels: [__meta_kubernetes_namespace]
        target_label: namespace
Here you’re explicitly controlling labels – this is your performance and cost control panel.
4.2 ELK: Filebeat + Logstash + Elasticsearch + Kibana
Flow:
Apps / servers → Filebeat → Logstash → Elasticsearch → Kibana
Minimal filebeat snippet for log shipping:
filebeat.inputs:
  - type: log
    paths:
      - /var/log/*.log
    fields:
      env: prod
      app: payments

output.logstash:
  hosts: ["logstash:5044"]
In Logstash, you parse and enrich:
input {
  beats {
    port => 5044
  }
}

filter {
  json {
    source => "message"
    skip_on_invalid_json => true
  }
  mutate {
    add_field => { "app_env" => "%{[fields][env]}" }
  }
}

output {
  elasticsearch {
    hosts => ["elasticsearch:9200"]
    index => "logs-%{+YYYY.MM.dd}"
  }
}
All parsed fields become indexed for fast queries.
4.3 OpenSearch: FluentBit + OpenSearch Dashboards
Swap Elasticsearch/Kibana with OpenSearch/OpenSearch Dashboards; ingestion stack stays similar.
Example Fluent Bit → OpenSearch:
[OUTPUT]
    Name            opensearch
    Match           *
    Host            opensearch-cluster
    Port            9200
    Index           logs-${TAG}
    Suppress_Type_Name On
    HTTP_User       fluent_user
    HTTP_Passwd     ${FLUENT_PASSWORD}
Same pattern: each log is a JSON document in an index.
5. How to Actually Choose for Production
Let’s stop being polite and make a decision framework.
5.1 Choose Loki if…
- You are heavily Kubernetes + Prometheus/Grafana already.
- Your main workflows are:
- “Show me logs for this pod/service around this alert.”
- “Correlate this metric spike with logs.”
- You care a lot about cost and S3-based retention.
- You can enforce sane label hygiene (no
user_id,request_idas labels, etc.). (Grafana Labs)
You accept that:
- Random ad-hoc text search across 30 days of logs won’t be as fast as ELK.
- Some complex investigations may be a bit more manual.
5.2 Choose ELK if…
- You need strong security / compliance / SIEM capabilities on top of logs. (Logz.io)
- Your teams already have Elasticsearch skills and operational muscle.
- You require:
- Deep aggregations and dashboards over log fields.
- Advanced search (regex, fuzzy, proximity, etc.).
- Ecosystem integrations (APM, SIEM, etc.).
You accept that:
- You’ll spend significant time on index lifecycle policies, shard sizing, and JVM tuning. (DEV Community)
- At scale, you must implement hot/warm/cold storage architecture to not blow up storage bills.
5.3 Choose OpenSearch if…
- You want ELK-style capabilities, but:
- Prefer fully open-source licensing, or
- Are invested in AWS and want Amazon OpenSearch Service. (Netdata)
- You don’t need every closed-source Elastic-only feature, but want:
- Full-text search, aggregations.
- Dashboards, alerting, observability plugins.
You accept that:
- Ecosystem and docs are slightly less polished than Elastic’s.
- You still carry roughly the same operational complexity as ELK.
6. Hybrid & Migration Patterns (Real-World)
Reality: many orgs end up with hybrid architectures instead of choosing one forever.
Common patterns: (SigNoz)
- Loki for “fresh” operational logs + OpenSearch for compliance audit logs
- Loki: 7–14 days, cheap, used by SREs.
- OpenSearch: 90–365 days, limited subset of logs (auth, payments, PII-sensitive).
- Start with Loki, later mirror critical streams into ELK/OpenSearch
- Use Promtail/FluentBit to dual-ship only key log streams.
- Most traffic = Loki; only “high-value” logs hit the expensive search engine.
- Migration from ELK → OpenSearch
- For cost/licensing reasons, retain the ingestion pipeline, swap the backend cluster.
Brutal but true: “Centralize absolutely everything into ELK forever” is how you end up explaining a 6-figure log bill to finance.
7. Best Practices & Common Pitfalls
7.1 Loki – Best Practices
- Design labels explicitly
- Only stable, low-cardinality labels:
namespace,app,cluster,env. - Treat labels as dimensions, not “whatever metadata we have”. (Grafana Labs)
- Only stable, low-cardinality labels:
- Use logs + metrics together
- Drive Loki queries from Prometheus alerts.
- Use object lifecycle policies on S3/GCS
- Archive to Glacier / Coldline after X days if you rarely query old logs.
Pitfalls:
- Putting
request_id,user_id, or headers as labels → cardinality explosion → cluster meltdown. - Treating Loki as “Elasticsearch but cheaper” and expecting identical search ergonomics.
7.2 ELK / OpenSearch – Best Practices
- Index lifecycle management (ILM) from day one
- Hot (SSD, frequent queries) → warm (slower, cheaper) → cold/frozen.
- Template your index mappings
- Don’t let everything be
text+keywordby default; narrow mappings where possible.
- Don’t let everything be
- Limit high-cardinality fields
- Don’t index giant random strings like raw stack traces or correlation IDs if you don’t need to search by them.
- Apply sampling or log level policies
- Do you really need all debug logs from every sidecar in prod?
Pitfalls:
- “Just ship all logs, we’ll clean it up later” → you won’t, and your cluster will suffer.
- One giant index for everything instead of per-app / per-namespace patterns.
- No alerting on cluster health (heap, disk watermark, queue sizes).
8. Quick Decision Checklist
Answer these honestly:
- Primary platform?
- Mostly Kubernetes + Prometheus? → Start with Loki.
- Mixed legacy VMs, appliances, Windows, etc.? → ELK or OpenSearch.
- Main usage pattern?
- “Show me logs for this service around 10:32 UTC” → Loki wins.
- “Search for this error text across the fleet over 30 days” → ELK/OpenSearch wins.
- Budget & team capacity?
- Small SRE team, cost pressure → Loki or managed OpenSearch.
- Larger team, observability platform ambitions → ELK or OpenSearch.
- Regulatory/compliance requirements?
- Long retention, forensic investigations → ELK/OpenSearch for the retained subset.
If you’re still torn:
Use Loki as your default logging plane, and send only high-value security/transaction logs to ELK/OpenSearch.
That’s the sane middle ground.
9. Conclusion & Takeaways
- Loki is your go-to for cheap, scalable, k8s-centric logging tightly integrated with Prometheus & Grafana.
- ELK remains the powerhouse for rich log analytics and SIEM, but you pay in money and operational complexity.
- OpenSearch gives you ELK-style capabilities with open licensing and strong AWS integration.
In practice, the best setups are intentional hybrids, not tool monocultures. Treat logs as a product: define consumers, retention, and query patterns before you choose the engine.
Internal Link Ideas (for Your Blog)
You could internally link this article to:
- “Designing Log Schemas for Distributed Systems” – how to structure JSON logs.
- “Prometheus + Loki: Unified Observability on Kubernetes” – metrics + logs flow.
- “Cost Optimization for Observability: Metrics vs Logs vs Traces”.
- “Elasticsearch Performance Tuning for Log Analytics”.
- “Migrating from ELK to OpenSearch: A Step-by-Step Guide”.
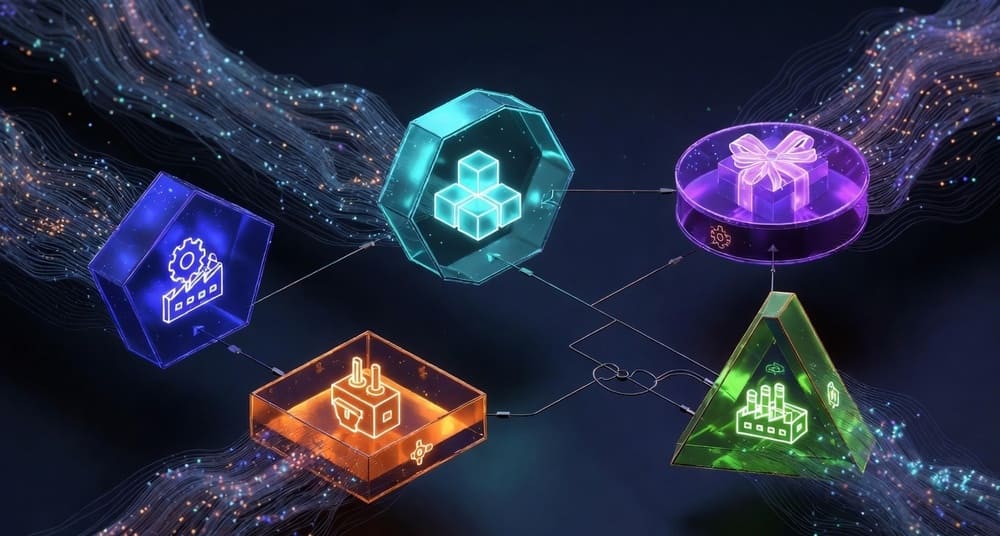
Image Prompt (for DALL·E / Midjourney)
“A clean, modern observability architecture diagram comparing three logging stacks: Loki with object storage and labels, an ELK stack with Elasticsearch, Logstash, and Kibana, and an OpenSearch cluster with dashboards; minimalistic, high-contrast, 3D isometric style, dark background, neon accents.”
Tags
Hashtags:
#Loki #ELK #OpenSearch #Logging #Observability #DevOps #SRE #Kubernetes #Elasticsearch #Grafana


Leave a Reply