
Data-driven organizations rely heavily on clean, trustworthy data to power analytics, machine learning, and business intelligence. As data volumes grow and pipelines become more complex, it’s crucial to implement robust data quality and observability practices. Let’s explore how you can enforce standards and gain end-to-end visibility using a combination of open-source tools.
1. Why Data Quality & Observability Matter
- Data-Driven Decision Making: Inaccurate or incomplete data can lead to misguided strategies and lost revenue.
- Complex Data Pipelines: As you integrate multiple sources and transformations, ensuring that data remains accurate becomes more challenging.
- Regulatory Compliance: Laws like GDPR or HIPAA mandate certain data handling and accuracy standards.
- Trust & Confidence: Users—from data scientists to executives—need confidence that the data powering analytics is reliable.
2. Enforcing Data Quality with Great Expectations
Great Expectations is a popular, open-source library that helps you define, execute, and document data tests (called “Expectations”). These tests can be automated at different points in your data pipeline.
2.1 Key Concepts
- Expectations: Assertions about data, such as “all values in price column must be non-negative.”
- Suites: Collections of expectations. Each suite can be applied to one or more datasets.
- Validation: Running a suite against a dataset to produce a validation report.
- Data Docs: Auto-generated documentation in a user-friendly web format, capturing test results over time.
2.2 Quick Example
Below is a simple Python snippet illustrating how to create and run an expectation suite:
import great_expectations as ge

# Load a DataFrame with Great Expectations
df = ge.read_csv("data/orders.csv")

# Create expectations
df.expect_column_values_to_not_be_null(column="order_id")
df.expect_column_values_to_be_between(
    column="order_amount", min_value=0, max_value=10000
)

# Validate the data
validation_result = df.validate()

# Print summary
print(validation_result) Tip: Integrate these validations into your CI/CD pipeline or Airflow jobs. If a validation fails, your pipeline can halt and alert your data team before bad data propagates.
3. Data Quality Testing with dbt
dbt (data build tool) is a transformation framework that operates on top of your warehouse (e.g., Snowflake, BigQuery, Redshift). It encourages version-controlled SQL transformations in a “software-engineering” style.
3.1 dbt Tests
dbt includes a testing framework that allows you to define both schema tests and data tests:
- Schema Tests: Check for column constraints like uniqueness, not null, or referential integrity.
- Data Tests: Custom SQL queries returning zero rows if the data meets expectations (non-zero rows indicate failures).
Example of a custom data test in a .sql file:
-- tests/order_amount_positive.sql
SELECT *
FROM {{ ref('orders') }}
WHERE order_amount < 0
If this query returns any rows, the test fails.
3.2 Automation & Documentation
- dbt run executes transformations, and dbt test runs the tests afterward.
- Documentation: dbt docs generate auto-generates an interactive data lineage and documentation site, showing test coverage and results.
Tip: Combine Great Expectations (for row-level validations) with dbt tests (for transformation-level checks and schema testing) to create comprehensive data quality coverage.
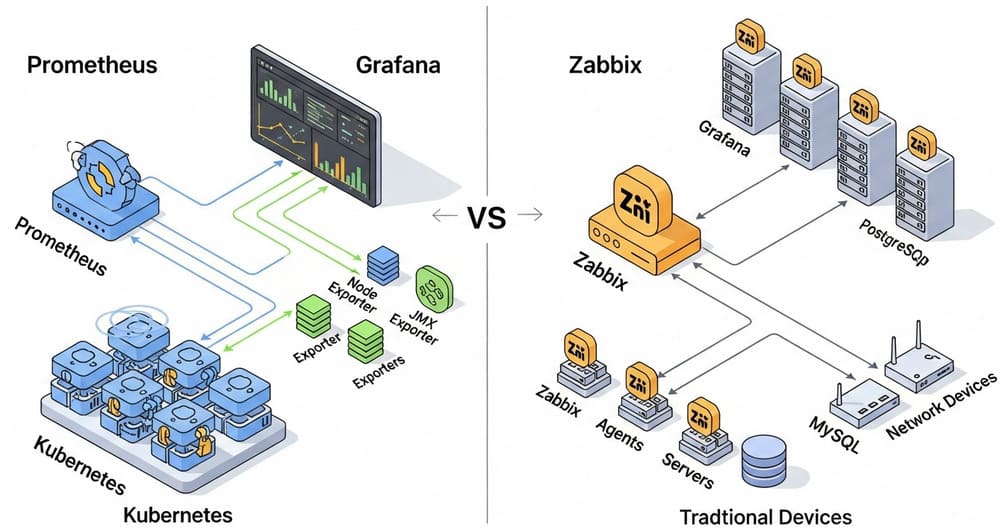
4. Observability with Prometheus & Grafana
While Great Expectations and dbt focus on data correctness, observability addresses pipeline performance, resource usage, and system health. Observability ensures you’re aware of:
- Pipeline latencies and run durations
- Resource constraints (CPU, memory, disk usage)
- Throughput (records processed per second)
- Failures and error rates
4.1 Prometheus for Metrics Collection
Prometheus is an open-source system for collecting metrics from various applications or services:
- Install Prometheus on a server/cluster.
- Instrument your pipeline code or orchestration tool (like Airflow or Kubernetes) with Prometheus exporters.
- Scrape Targets: Prometheus pulls metrics from defined targets on a schedule.
- Rule-Based Alerts: Configure Prometheus alert rules (e.g., “Alert me if pipeline_run_duration > 30 minutes”).
Example: A simple Python snippet to expose pipeline metrics using the prometheus_client library:
from prometheus_client import start_http_server, Counter
import time

pipeline_runs = Counter('pipeline_run_count', 'Number of pipeline runs')

def run_pipeline():
    pipeline_runs.inc()
    # ... pipeline code ...

if __name__ == '__main__':
    # Start Prometheus metrics server
    start_http_server(8000)

    while True:
        run_pipeline()
        time.sleep(3600)  # run every hour
4.2 Grafana for Visualization
Grafana is a popular open-source analytics and visualization platform that can be configured to query data from Prometheus:
- Dashboards: Build interactive charts and graphs for pipeline run times, data volumes, error counts, etc.
- Alerts: Grafana can also send alerts (email, Slack) if metrics exceed thresholds.
- Plugins & Integrations: Leverage a wide range of community plugins to visualize data in dynamic ways.
Tip: Combine Prometheus and Grafana with logs from your orchestration tools for a comprehensive view of both data quality (through test frameworks) and pipeline health (through metrics).
5. Best Practices for Reliable Pipelines
- Shift Left on Data Quality
- Automate Testing & Validation
- Version Control & Documentation
- Define Service Level Objectives (SLOs)
- Alerting & Incident Response
- Continuous Improvement
6. Conclusion
Modern data pipelines need more than just transformations and storage. They require robust data quality checks and observability to ensure continuous reliability and trust in your data products. By combining:
- Great Expectations for robust, human-readable data validations,
- dbt tests for schema-level checks and pipeline-based testing, and
- Prometheus / Grafana for real-time metrics and visualization of pipeline health,
you can create a proactive data culture where potential issues are caught early, documented thoroughly, and resolved quickly. This holistic approach to data quality and observability helps ensure your analytics, machine learning models, and business intelligence efforts are powered by accurate, reliable data.
Further Reading & Resources
- Great Expectations Documentation: https://docs.greatexpectations.io
- dbt (Data Build Tool): https://docs.getdbt.com
- Prometheus: https://prometheus.io/docs/introduction/overview/
- Grafana: https://grafana.com/docs/grafana/latest/
- Airflow Observability Example: https://airflow.apache.org/docs/apache-airflow/stable/metrics.html
By adopting these practices and tools, you’ll be well-positioned to maintain high-fidelity data pipelines that your organization can rely on for mission-critical insights.


Leave a Reply