Looker in 2026: What Makes It Different from Other BI Tools
Introduction
Business intelligence tools all promise the same thing. Connect to your data, build dashboards, share insights. Tableau does it. Power BI does it. So does Qlik, Sisense, and a dozen others.
Looker takes a different path. Instead of dragging and dropping visualizations, you define metrics in code. Instead of each analyst creating their own version of “revenue,” you build one definition everyone uses. Instead of extracts and imports, Looker queries your database directly.
This approach has trade-offs. Some teams love it. Others find it overcomplicated for their needs.
This guide explains what Looker actually is, how it works differently from traditional BI tools, and whether it fits your organization.
What Makes Looker Different
Most BI tools follow the same pattern. Connect to data sources, let users drag fields onto canvases, generate SQL behind the scenes. Users don’t need to know SQL. They click and point.
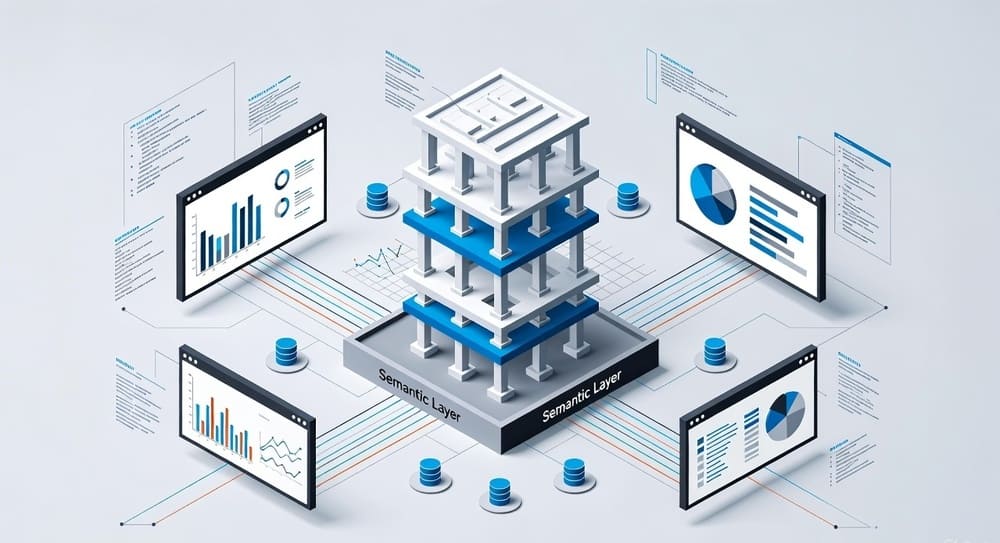
Looker flips this model. At its core is LookML, a modeling language that defines your data structure, relationships, and business logic. Analysts and data teams write LookML to create a semantic layer. Business users then explore data through this layer.
The semantic layer is key. Instead of everyone writing their own queries or building their own calculations, you define metrics once. “Monthly Recurring Revenue” means the same thing whether you’re in sales, finance, or the executive dashboard.
Looker stays connected to your database. When someone views a dashboard, Looker generates SQL and runs it against your warehouse. No extracts, no stale data, no wondering if numbers are current.
Google acquired Looker in 2019 for $2.6 billion. It’s now part of Google Cloud Platform, though it still works with other cloud providers.
The LookML Model
LookML is where Looker diverges most from competitors. It’s a YAML-based language for defining your data model.
You define dimensions (columns in your tables), measures (aggregations like count or sum), and relationships between tables. You can create derived fields, custom calculations, and complex business logic.
Here’s what this looks like in practice. Instead of each dashboard creator calculating customer lifetime value differently, you define it once in LookML. Everyone who uses “Customer LTV” gets the same calculation.
The benefits are real. Consistency across reports. Centralized business logic. Changes propagate everywhere. If you update how revenue is calculated, every dashboard updates automatically.
The downside is overhead. Someone needs to write and maintain LookML. Small changes require code changes and deployment. Business users can’t just connect and start building without this foundation.
LookML lives in Git repositories. You version control your data model like code. You can branch, review changes, and deploy through CI/CD pipelines. For engineering-minded teams, this is natural. For traditional BI teams, it’s a learning curve.
How Business Users Experience Looker
Once the LookML model exists, business users work in the Explore interface. This is where Looker feels more like traditional BI.
Users pick dimensions and measures from the model. They add filters, choose visualization types, and build charts. The interface generates SQL queries based on their selections.
The Explore interface is clean but less intuitive than Tableau or Power BI. There’s a learning curve. Users need to understand the difference between dimensions and measures. They need to know which fields can be combined.
Power users can write custom SQL or table calculations for complex analysis. But most users stick to what’s defined in the model.
Dashboards are collections of visualizations. You can add filters, drill paths, and interactive elements. Dashboards load fresh data each time someone views them.
The visualization options are adequate but not exceptional. Basic charts, tables, maps. Nothing as polished as Tableau’s visual grammar. Most teams supplement Looker with other tools for complex or custom visualizations.
Architecture and Technical Implementation
Looker is a web application. You access it through a browser. Google hosts it (Looker Cloud) or you can run it on your own infrastructure (Looker On-Premises).
The architecture has three main components. The Looker application server runs the web interface and generates SQL. The LookML model defines your semantic layer. Your database executes queries and returns results.
Looker doesn’t store your data. It’s not a data warehouse. When you run a query, Looker generates SQL, sends it to your warehouse, and displays results. This means query performance depends entirely on your database.
This architecture has implications. Your warehouse needs to be fast. Slow databases mean slow dashboards. You need to optimize your tables, use proper indexing, and potentially create aggregate tables for common queries.
Looker supports most modern databases. BigQuery, Snowflake, Redshift, Databricks. Also traditional databases like MySQL, PostgreSQL, SQL Server. The SQL Looker generates varies by database dialect.
The persistent derived tables feature lets you materialize complex queries. Looker creates and maintains tables in your warehouse for expensive calculations. This improves performance for dashboards that use them.
Development Workflow
Building in Looker follows a software development workflow. This is different from traditional BI tools where changes are immediate.
You work in a development branch of the LookML project. Make changes, test them, preview how they’ll affect existing content. When ready, create a pull request. Someone reviews the changes. After approval, merge to production.
This process ensures quality but adds friction. Quick changes take longer. You can’t just hop into a dashboard and tweak something. You need access to the LookML project, understand the model, and follow the deployment process.
For data teams comfortable with Git and code review, this feels natural. For business analysts used to Tableau or Power BI, it’s frustrating.
The IDE is basic. You can write LookML in the web interface or use external editors. Most serious developers use VS Code with Looker extensions for better syntax highlighting and validation.
Testing is limited. You can validate LookML syntax and preview queries. But there’s no comprehensive testing framework. Many teams build custom validation scripts.
Integration and Extensibility
Looker integrates with the modern data stack. It connects to your warehouse, pulls from dbt models, and pushes results to other tools.
The API is comprehensive. You can programmatically manage users, run queries, create dashboards, and extract data. Many teams build automation around the API.
Actions let you send data from Looker to other systems. Send Slack messages when metrics hit thresholds. Push records to Salesforce. Trigger workflows in other tools. The action framework is flexible and well-designed.
Embedding Looker in other applications is a major use case. The platform was built for this. You can embed entire dashboards, specific visualizations, or the Explore interface. The embedding SDK gives fine-grained control over what users see and do.
Custom visualizations are possible but require JavaScript development. The community has built various custom viz types. But if you need unique visualizations regularly, other tools are easier.
Performance Considerations
Looker performance depends almost entirely on your database. Looker generates SQL. Your warehouse runs it. If your warehouse is slow, Looker is slow.
This means optimization happens at the database level. Create aggregate tables for common metrics. Use clustering and partitioning on cloud warehouses. Monitor query performance and optimize expensive queries.
Looker provides caching to reduce database load. Query results cache for a configurable time. If someone requests the same data within the cache window, Looker returns cached results.
Persistent derived tables help with complex calculations. Instead of running expensive queries every time, materialize results in a table. Looker keeps it updated on a schedule.
The PDT approach works well but requires planning. You need to decide what to materialize, how often to refresh, and manage the storage costs.
Some teams hit performance walls with Looker. Dashboards with dozens of tiles each running separate queries can be slow. Users waiting 30 seconds for a dashboard to load get frustrated.
The solution usually involves optimization work. Aggregate tables, better database configuration, or rethinking the dashboard design. But this requires engineering resources.
Where Looker Excels
Governed metrics and definitions. This is Looker’s strongest feature. When everyone uses the same metric definitions, trust in data increases. Arguments about “which revenue number is right” disappear.
Git-based workflow. For data teams that think like engineers, version control and code review for BI content makes sense. You can track changes, roll back mistakes, and maintain quality through reviews.
Embedding and white-labeling. Looker was built to embed in other applications. If you’re building a SaaS product that needs analytics, Looker provides a full BI layer you can embed.
Database agnostic approach. Looker works with most modern databases. Switch from Redshift to Snowflake? Update the connection. Your LookML model stays the same.
API-first design. Everything you can do in the UI, you can do through the API. This enables automation, custom workflows, and integration with other tools.
Collaboration features. Scheduled deliveries, alerts, shared folders, and boards for organizing content work well. Teams can organize and share insights effectively.
Where Looker Struggles
Steep learning curve. Both for developers writing LookML and business users exploring data. Compared to Tableau or Power BI, it takes longer to become productive.
Limited visualization capabilities. The charts are functional but basic. If you need sophisticated visualizations or custom chart types, you’ll be frustrated. Many teams use Looker for exploration and other tools for presentation.
Development overhead. Every change requires code changes and deployment. Quick iterations are slower than tools where you can directly modify dashboards.
Performance entirely dependent on database. If your warehouse is slow or poorly optimized, Looker can’t compensate. You need strong database engineering to make Looker perform well.
Cost. Looker is expensive. Pricing is per user and scales up quickly. Smaller companies often find it prohibitively expensive compared to alternatives.
Mobile experience is weak. The mobile app exists but isn’t great. Dashboards designed for desktop don’t translate well to phones. This matters if mobile access is important.
Looker vs. Competitors
Looker vs. Tableau
Tableau excels at visualization and exploration. The drag and drop interface is intuitive. Creating beautiful, complex visualizations is easier. But metric definitions are decentralized. Each workbook can calculate things differently.
Looker trades visualization power for governance. The semantic layer ensures consistency. But creating that layer requires engineering effort. Tableau is better for ad-hoc analysis and presentation. Looker is better for standardized reporting with governed metrics.
Looker vs. Power BI
Power BI has the Microsoft ecosystem advantage. It’s cheaper. The integration with Excel and other Office tools is seamless. The visualization capabilities are strong.
But Power BI’s semantic layer (Power BI datasets) is less robust than LookML. Version control is harder. The development workflow isn’t code-based.
Choose Power BI if you’re already in the Microsoft ecosystem and need a cost-effective solution. Choose Looker if you need stronger governance and don’t mind the code-based approach.
Looker vs. Mode Analytics
Mode targets analysts who write SQL. The notebook interface combines SQL queries, Python analysis, and visualizations. It’s more flexible for custom analysis.
Looker provides more structure. The semantic layer enforces consistency. Mode gives more freedom but less governance.
Mode works well for data teams doing exploratory analysis. Looker works better for standardized reporting to business users.
Looker vs. Sigma
Sigma is newer. It provides a spreadsheet interface on top of your cloud warehouse. Business users work in a familiar Excel-like environment while queries run directly on the database.
Sigma is easier for business users than Looker. No learning curve for the interface. But it lacks Looker’s semantic layer and governance features.
If ease of use for business users is priority one, Sigma wins. If governed metrics and engineering-friendly workflows matter more, Looker wins.
Implementation Considerations
You need strong database infrastructure. Looker’s performance depends on your warehouse. Make sure you have a fast, well-optimized database before implementing Looker.
Someone needs to build and maintain LookML. This isn’t a side project. You need dedicated resources to develop the semantic layer, maintain it, and evolve it as business needs change.
Training is essential. Both for developers writing LookML and business users exploring data. Budget time and resources for onboarding.
Start with a limited scope. Don’t try to model your entire data warehouse on day one. Pick a high-value use case, build it well, get users comfortable, then expand.
Integrate with your existing stack. Looker works best as part of a modern data platform. Connect it to your warehouse, pull from dbt models, integrate with your data catalog.
Plan your governance model. Who can create new content? How do changes get reviewed? What’s the process for updating the LookML model? Define this early.
Consider total cost. Beyond licensing, account for engineering time to build and maintain LookML, database costs for query execution, and training costs.
Common Use Cases
Standardized business reporting. When you need everyone looking at the same metrics calculated the same way, Looker shines. Monthly business reviews, executive dashboards, and departmental reporting work well.
Embedded analytics. If you’re building a product that includes analytics for your customers, Looker’s embedding capabilities are strong. Many B2B SaaS companies use Looker this way.
Self-service analytics with guardrails. Give business users the ability to explore data while ensuring they work within a governed framework. The semantic layer provides the guardrails.
Data democratization at scale. For large organizations with many users, Looker scales well. The code-based approach and version control handle complexity better than traditional BI tools.
Integration with modern data stacks. If you’re using dbt, Airflow, Snowflake, and other modern data tools, Looker fits naturally into that ecosystem.
Is Looker Right for You?
Looker fits best when you have engineering resources to build and maintain the semantic layer, need strong metric governance across many users, are comfortable with code-based workflows, have a fast cloud data warehouse, value embedding or API access, and can justify the cost.
Looker probably isn’t right if you’re a small team without dedicated data engineering, need quick time-to-value without upfront modeling work, prioritize sophisticated visualizations, want business users to self-serve without much training, or are working with a limited budget.
The tool requires investment. Building the LookML model takes time. Training users takes time. Optimizing performance takes time. But for organizations that make that investment, Looker provides a solid foundation for data democratization with governance.
Key Takeaways
Looker differentiates itself through LookML and the semantic layer approach. Metrics get defined once and used consistently everywhere.
The code-based workflow fits engineering-minded teams but creates friction for traditional BI users.
Performance depends entirely on your database. You need strong data warehouse infrastructure.
Visualization capabilities are adequate but not exceptional. Use other tools if custom or sophisticated visualizations matter.
The embedding and API capabilities are excellent. This makes Looker strong for product analytics and custom integrations.
Cost is significant. Make sure the benefits justify the expense for your organization.
Implementation requires dedicated resources. This isn’t a tool you can just turn on and expect immediate value.
For organizations with the right resources and requirements, Looker provides strong governance and scalability. For others, simpler tools may be better fits.
Tags: Looker, business intelligence, BI tools, LookML, semantic layer, data visualization, data governance, embedded analytics, Google Cloud, cloud data warehouse, self-service analytics, data modeling, Snowflake, BigQuery, enterprise BI, analytics platform, metric definitions, data democratization


