Fluentd for Data Engineers: How to Build a Unified Logging Layer That Doesn’t Suck
If you’ve ever been on-call at 2 a.m. grepping random EC2 boxes for logs, Fluentd is the tool that could’ve saved your night.
Fluentd is an open-source data/log collector that sits between your systems and your destinations (S3, Elasticsearch, Kafka, BigQuery, etc.) and gives you a unified logging layer: one place to collect, parse, enrich, buffer, and ship events at scale. (Fluentd)
This is exactly the kind of “boring but critical” plumbing data engineers are supposed to own.
What is Fluentd (and Why Should You Care)?
Fluentd is:
- An open-source data collector for logs and events
- Designed to unify data collection and consumption across many sources and sinks
- Backed by CNCF, with a large plugin ecosystem (inputs, filters, outputs) (Fluentd)
In practice, you use Fluentd to:
- Collect logs from apps, Nginx, systemd, Kubernetes, etc.
- Parse and normalize them (usually into JSON)
- Enrich with metadata (environment, pod labels, region, tenant)
- Buffer them safely to disk
- Ship them to multiple destinations: S3/data lake, Elasticsearch/OpenSearch, Kafka, Splunk, cloud logging, etc. (Akamai)
If your current setup is “each app logs wherever it wants” and you then try to do analytics… you’re paying an operational tax every single day.
Fluentd Architecture in Plain English
Fluentd uses a modular pipeline:
| Component | What it does | Example |
|---|---|---|
| Input | Where events enter | tail a log file, read from TCP, HTTP |
| Parser | Turns raw text → structured event | Parse JSON, regex, nginx/apache formats |
| Filter | Enrich/transform events | Add Kubernetes metadata, drop noisy logs |
| Buffer | Temporarily stores events (memory/disk) | Handles retries, backpressure |
| Output | Sends events to destinations | S3, Elasticsearch, Kafka, cloud logging |
Everything revolves around tags. An event flows:
<source> → [parser] → [filters] → [buffer] → <match (output)> (DeepWiki)
High-level picture:
[App / Nginx / Node]
        |
   (in_tail / in_http)
        v
     [Parser]
        v
     [Filter]  <- add env, k8s labels, PII masking
        v
     [Buffer]
        v
   [Output: S3, ES, Kafka]
Fluentd strongly encourages JSON as the internal format, so downstream processing is less painful than dealing with random text formats. (Fluentd)
A Minimal Fluentd Pipeline Example
Let’s say you want to:
- Tail an application log file that emits JSON lines
- Add environment + service name
- Send logs to Elasticsearch (or OpenSearch)
fluent.conf example:
# 1. Source: tail a log file
<source>
  @type tail
  path /var/log/myapp/app.log
  pos_file /var/log/fluentd-myapp.pos
  tag app.myapp
  <parse>
    @type json
  </parse>
</source>

# 2. Filter: add common fields
<filter app.**>
  @type record_transformer
  <record>
    environment  "prod"
    service_name "myapp"
  </record>
</filter>

# 3. Buffer + Output: send to Elasticsearch / OpenSearch
<match app.**>
  @type elasticsearch
  host es-logs.example.internal
  port 9200
  scheme http
  logstash_format true         # index per day: logstash-YYYY.MM.DD
  include_tag_key true
  flush_interval 10s
  buffer_type file
  buffer_path /var/log/fluentd-buffers/myapp.*.buffer
  retry_forever true
</match>
That’s already a production-ish pipeline:
- Tail local logs
- Parse JSON
- Enrich with context
- Buffer to disk (for reliability)
- Forward to Elasticsearch with retry
Scale this up across tens/hundreds of nodes and Fluentd becomes your central ingestion plane.
Fluentd in Modern Data Platforms
Where does Fluentd fit in a typical data platform?
Common patterns:
- Kubernetes DaemonSet – Fluentd runs on every node, collects container logs from
/var/log/containers, enriches with pod/namespace labels, and ships to a central cluster or cloud logging service. (Oracle Blogs) - Log → Data Lake – Fluentd writes to S3/GCS/Azure Blob in compressed JSON/Parquet for later batch analytics in Spark, Snowflake, BigQuery, etc. (Akamai)
- Log → Search – Ship enriched logs to Elasticsearch/OpenSearch/Splunk for incident response and dashboards.
- Log → Streams – Send logs to Kafka/Kinesis/Pub/Sub for real-time alerting and derived metrics.
Fluentd is especially useful when you need multiple downstream consumers:
- S3 for cheap cold storage
- Search cluster for ops
- SIEM for security
- A Kafka topic for real-time anomaly detection
You configure multi-routing in Fluentd instead of instrumenting every app for every destination.
Fluentd vs Fluent Bit – Which One Should You Use?
Reality check: Fluent Bit is now considered the “next-gen” collector in many environments, especially Kubernetes and edge, due to its performance and low resource usage. (CNCF)
Quick comparison for data engineers:
| Feature | Fluentd | Fluent Bit |
|---|---|---|
| Language | Ruby | C |
| Footprint | Heavier | Very lightweight |
| Role | Full-featured aggregator | High-perf forwarder / collector |
| Plugins | Huge ecosystem | Smaller but growing, more built-in |
| Custom logic | Ruby filters | Lua filters (more performant) |
| Cloud adoption trend | Older installs | Newer deployments default here |
Practical guidance:
- Use Fluent Bit as your per-node agent in Kubernetes / edge / containers for performance.
- Use Fluentd as a central aggregator / transformer if you need richer processing and exotic plugins. (Chronosphere)
You don’t have to be religious about it: they speak the same Forward protocol and can be chained together.
Best Practices for Production Fluentd
If you just “spin up Fluentd with defaults” and forget it, it will bite you. Here’s how to avoid that.
1. Treat JSON as the Contract
- Standardize on JSON for internal event structure.
- Normalize field names across services (
request_id,user_id,service,env, etc.). - Enforce this in your app logging libraries and Fluentd parsers. (Fluentd)
2. Design Tags Intentionally
Tags drive routing:
- Use patterns like
env.service.component→prod.myapp.api,prod.gateway.nginx. - Use
**wildcards in<match>to route logical groups. - Avoid random tag formats per team.
3. Get Buffering Right (This Is Where People Screw Up)
- Use file buffers for anything critical; memory-only buffers risk data loss on restart.
- Set reasonable chunk and queue limits so Fluentd doesn’t eat the node’s disk.
- Configure backoff + retries for flaky destinations (cloud search / SIEM). (Fluentd)
4. Secure Your Pipelines
- Use TLS and authentication to outputs (especially over the internet).
- Be explicit about PII masking in filters (hash emails, drop sensitive fields).
- Don’t store secrets in
fluent.conf– use env vars or secret managers.
5. Make Configs Modular
- Split config by concern:
sources/*.conf,filters/*.conf,outputs/*.conf. - Use
@includeand consistent naming conventions. - Version control all config and treat it like application code (CI checks, code review).
6. Monitor Fluentd Itself
If you’re not monitoring Fluentd, you’re flying blind:
- Track buffer usage, retries, error counts, throughput. (DataOps Redefined!!!)
- Expose metrics to Prometheus/Grafana or your APM.
- Add alerts for backpressure signals (queue near limit, retry storms).
Common Pitfalls (and How to Avoid Them)
Let’s be blunt: these are the mistakes that separate a “toy lab setup” from a system you trust at 3 a.m.
- Unbounded regex parsing everywhere
- Heavy regex parsers on massive log volumes = CPU furnace.
- Prefer JSON logs; reserve regex for legacy logs only.
- Single giant Fluentd doing everything
- One massive instance handling all parsing, enrichment, fan-out → hard to scale, hard to debug.
- Better: agent layer (Fluent Bit / lighter Fluentd) + central aggregators.
- No dead-letter queue (DLQ)
- Bad events either get dropped or block buffers.
- Add a separate output for malformed events (e.g., S3 bucket
logs_dlq/).
- Ignoring schema drift
- Teams add fields randomly, break dashboards and alerts.
- Maintain schema contracts and validation at the edge or in filters.
- Overusing custom Ruby logic
- Inline Ruby in config is powerful but can tank performance at scale. (CNCF)
- Keep heavy transforms in downstream systems (Spark, Flink, dbt) or a dedicated streaming layer.
Conclusion: Where Fluentd Fits in Your Data Stack
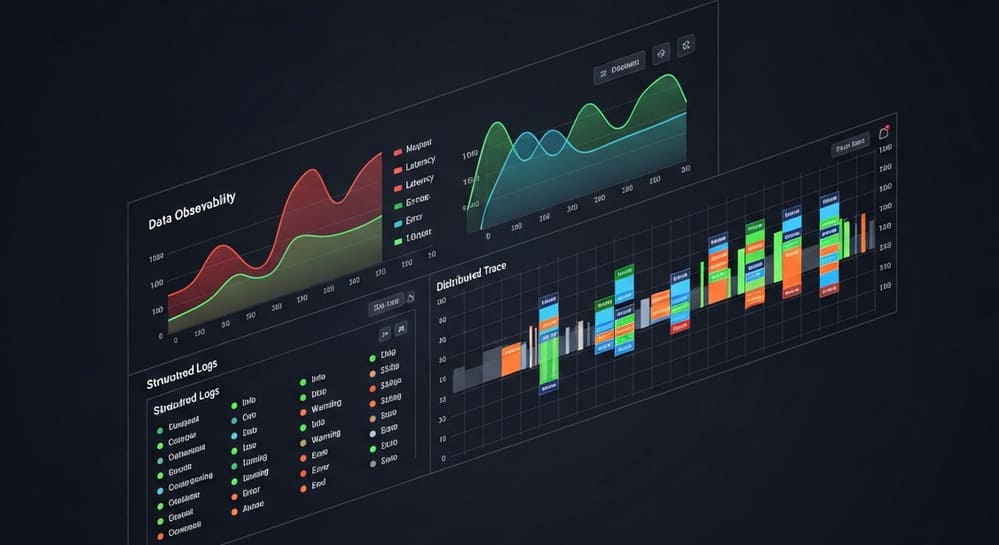
Fluentd is not “sexy,” but it’s the backbone of a serious observability and logging strategy:
- It decouples producers from consumers via a unified logging layer.
- It makes logs queryable, analyzable, and cheaper to store.
- It plays nicely with modern stacks: Kubernetes, cloud logging, data lakes, and real-time analytics.
As a data engineer, your job is to make data reliable and accessible. Fluentd (often paired with Fluent Bit) is one of the cleanest ways to do that for logs and event streams.
Key Takeaways
- Use Fluentd as a central, flexible log/data aggregator.
- Standardize on JSON + consistent fields across services.
- Get serious about buffering, backpressure, and monitoring.
- Be pragmatic: combine Fluent Bit (edge) and Fluentd (aggregation) where it makes sense.
If you’re still tailing logs manually or piping them directly to a single expensive SaaS, you’re leaving both reliability and money on the table.
Internal Link Ideas (for a Blog)
You could interlink this article with:
- “Fluent Bit vs Fluentd: Choosing the Right Log Collector for Kubernetes”
- “Designing a Telemetry Pipeline: Logs, Metrics, and Traces for Data Engineers”
- “Building a Log Data Lake on S3 for Snowflake/Spark Analytics”
- “Schema Design for Event Logs: How to Avoid JSON Chaos”
Image Prompt (for DALL·E / Midjourney)
A clean, modern observability architecture diagram showing multiple microservices sending logs into Fluent Bit agents, then into a central Fluentd aggregator that fans out to S3, a search cluster, and a monitoring system — minimalistic, high contrast, 3D isometric style.
Tags
#Fluentd #Logging #Observability #DataEngineering #FluentBit #Kubernetes #LogAggregation #Telemetry #BigData #Architecture


