
Structured Logging 101 for Python & Kubernetes
How to stop grepping random strings in production at 2 a.m.
Introduction: Why Your Logs Are Lying to You
If your current “logging strategy” is print() plus a few logger.info("Something happened"), you don’t have a logging strategy.
In Python apps running on Kubernetes, unstructured logs quickly become useless:
- You can’t reliably filter by request ID or user ID.
- You can’t correlate logs across services.
- Dashboards and alerts based on text search are fragile and noisy.
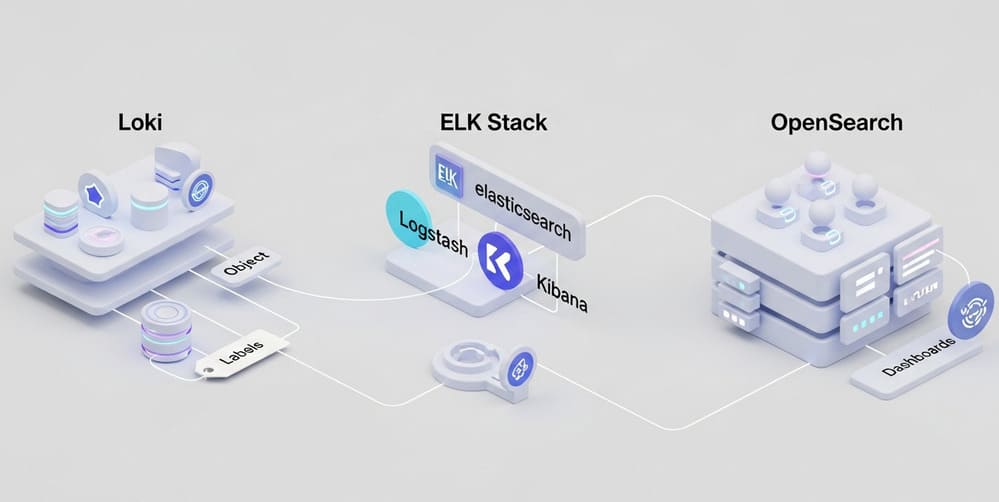
Structured logging fixes this by turning every log line into data — typically JSON — that your log stack (Loki, Elasticsearch, OpenSearch, CloudWatch, Datadog, etc.) can parse, filter, and aggregate.
This article is a practical, opinionated guide to Structured Logging 101 for Python & Kubernetes: what it is, how to wire it up, and what to avoid so you don’t drown in JSON noise.
1. What Is Structured Logging?
Traditional logging:
[2025-11-26 10:30:01] INFO User logged in: user_id=42
This looks readable, but for your log system it’s just a blob of text.
Structured logging:
{"ts":"2025-11-26T10:30:01Z","level":"INFO","event":"user_login","user_id":42,"session_id":"abc123","service":"auth-api"}
Key differences:
- Machine-parsable: fields like
user_idare real keys, not text fragments. - Consistent shape: every log line shares a schema (level, timestamp, service, etc.).
- Queryable: you can run “give me all
event=user_loginwhereuser_id=42withlevel=ERRORin the last 15 minutes”.
In Kubernetes, structured logs are critical because:
- All containers write to stdout/stderr, and the platform ships those logs to a central backend.
- Without structure, your observability stack becomes regex hell.
- With structure, you can build real dashboards and alerts without brittle text searches.
2. Logging Architecture in Kubernetes (High-Level)
The typical flow in a Python app on Kubernetes:
- Your app writes structured logs to
stdout/stderr(JSON lines). - Container runtime / kubelet sends logs to node-level log files.
- A log agent (sidecar or DaemonSet) collects those logs:
- e.g. Fluent Bit / Fluentd / Vector / Promtail.
- The agent forwards logs to a backend:
- e.g. Loki, Elasticsearch/OpenSearch, Cloud Logging, Datadog, Splunk.
- You query, visualize, and alert in Grafana/Kibana/your log UI.
Key takeaway:
If your Python logs are already structured JSON, the rest of this pipeline becomes much simpler and more powerful.
3. Python: Making Logging Structured (Not a Mess)
3.1 Core Ideas
- Use the standard
loggingmodule (don’t reinvent). - Add a JSON formatter.
- Always log key-value pairs, not interpolated text.
- Standardize fields:
service,env,request_id,correlation_id,user_id, etc.
3.2 Minimal Structured Logger (Without Extra Libraries)
This is a small, “roll-your-own” JSON formatter. Good to understand, even if you later switch to a library.
import json
import logging
import sys
from datetime import datetime, timezone

class JsonFormatter(logging.Formatter):
    def format(self, record: logging.LogRecord) -> str:
        log = {
            "ts": datetime.fromtimestamp(record.created, tz=timezone.utc).isoformat(),
            "level": record.levelname,
            "logger": record.name,
            "message": record.getMessage(),
        }

        # Attach extra fields (from logger.<level>(..., extra={...}))
        if record.__dict__.get("extra_fields"):
            log.update(record.__dict__["extra_fields"])

        return json.dumps(log, separators=(",", ":"))  # compact JSON

def get_logger(name: str, service: str, env: str) -> logging.Logger:
    logger = logging.getLogger(name)
    logger.setLevel(logging.INFO)
    logger.propagate = False

    if not logger.handlers:
        handler = logging.StreamHandler(sys.stdout)
        handler.setFormatter(JsonFormatter())
        logger.addHandler(handler)

    # Store static context on the logger
    logger = logging.LoggerAdapter(logger, {"extra_fields": {"service": service, "env": env}})
    return logger

# Usage
logger = get_logger(__name__, service="payments-api", env="prod")

logger.info("Payment created", extra={"extra_fields": {"order_id": 123, "amount": 49.90}})
What’s going on:
JsonFormatterconverts aLogRecordinto a JSON dict and dumps it.LoggerAdapterinjects static fields (service,env) automatically.extra={"extra_fields": {...}}lets you add per-log structured data.
4. Correlation IDs & Request Context (The Real Value)
The biggest win in microservices: trace a single request across services.
You do that with:
correlation_idortrace_idrequest_id- Sometimes
span_id(if using tracing)
4.1 Example: FastAPI Middleware Injecting correlation_id
import uuid
from fastapi import FastAPI, Request
from starlette.middleware.base import BaseHTTPMiddleware

from my_logging import get_logger  # from previous snippet

app = FastAPI()
logger = get_logger(__name__, service="orders-api", env="prod")

class CorrelationMiddleware(BaseHTTPMiddleware):
    async def dispatch(self, request: Request, call_next):
        corr_id = request.headers.get("X-Correlation-ID", str(uuid.uuid4()))
        request.state.correlation_id = corr_id

        # Log request start
        logger.info(
            "request_start",
            extra={"extra_fields": {
                "event": "request_start",
                "method": request.method,
                "path": request.url.path,
                "correlation_id": corr_id,
            }},
        )

        response = await call_next(request)
        response.headers["X-Correlation-ID"] = corr_id
        return response

app.add_middleware(CorrelationMiddleware)

@app.get("/orders/{order_id}")
async def get_order(order_id: str, request: Request):
    logger.info(
        "fetch_order",
        extra={"extra_fields": {
            "event": "fetch_order",
            "order_id": order_id,
            "correlation_id": request.state.correlation_id,
        }},
    )
    return {"order_id": order_id}
Now you can query logs by correlation_id in your log backend and see:
request_startingatewayfetch_orderinorders-apicharge_customerinpayments-api
All tied to the same ID.
5. Kubernetes: How to Wire It Up Correctly
5.1 Container Logging Basics
To play nice with Kubernetes:
- Write logs to stdout/stderr, not local files.
- Log one JSON object per line.
- Don’t prepend timestamps or levels yourself if your formatter already handles it.
Deployment snippet (key part is env and no custom log path):
apiVersion: apps/v1
kind: Deployment
metadata:
  name: orders-api
spec:
  replicas: 3
  selector:
    matchLabels:
      app: orders-api
  template:
    metadata:
      labels:
        app: orders-api
    spec:
      containers:
        - name: orders-api
          image: my-registry/orders-api:1.0.0
          env:
            - name: LOG_LEVEL
              value: INFO
            - name: ENV
              value: prod
          ports:
            - containerPort: 8000
If you use a log agent (Fluent Bit, Promtail, etc.), configure it to:
- Treat each line as JSON.
- Add Kubernetes metadata (namespace, pod, container, node).
- Forward to your backend.
5.2 Log Fields: App vs Kubernetes
A rough separation of responsibilities:
| Source | Example Fields |
|---|---|
| App (Python) | service, env, event, user_id, order_id, correlation_id, message, level |
| K8s/Agent | kubernetes.namespace, kubernetes.pod, kubernetes.container, host, cluster |
Don’t duplicate Kubernetes metadata in your app logs; let the agent inject it.
6. Using a Library Instead of DIY (Recommended)
DIY JSON formatter is fine for learning. In real projects, use a mature library for:
- Better performance.
- Structured context management.
- Less boilerplate.
Two common Python choices:
6.1 structlog (very popular)
import logging
import structlog

logging.basicConfig(format="%(message)s", stream=sys.stdout, level=logging.INFO)

structlog.configure(
    processors=[
        structlog.processors.add_log_level,
        structlog.processors.TimeStamper(fmt="iso"),
        structlog.processors.dict_tracebacks,
        structlog.processors.JSONRenderer(),
    ],
    context_class=dict,
    logger_factory=structlog.stdlib.LoggerFactory(),
)

logger = structlog.get_logger(service="orders-api", env="prod")

logger.info("order_created", order_id=123, amount=49.9, currency="USD")
This prints a JSON object with all those fields, plus time and level.
6.2 loguru (batteries-included)
from loguru import logger
import sys

logger.remove()
logger.add(sys.stdout, serialize=True)  # JSON

logger = logger.bind(service="orders-api", env="prod")
logger.info("order_created", order_id=123, amount=49.9)
My blunt advice:
- If you’re already deep in standard
logging, considerstructlog. - If you’re starting fresh,
loguruis easier, but be mindful of integration with older code.
7. Log Levels, Sampling, and Avoiding Noise
Unstructured logging is bad.
But structured noise is worse — now you have expensive, high-quality noise.
7.1 Basic Rules
DEBUG: detailed per-step state; use heavily in dev, sampled or off in prod.INFO: important business events (order created, payment failed).WARNING: unexpected but handled situations (retry scheduled).ERROR: operation failed, user likely impacted.CRITICAL: system severely unhealthy.
7.2 Don’t Log the Following (or Be Extremely Careful)
- PII / secrets: emails, tokens, passwords, card numbers.
- Huge payloads: large JSON bodies, binary blobs.
- Per-item logs inside tight loops: log aggregates instead.
Example of aggregated logging instead of spamming:
def process_batch(items):
    success = 0
    failure = 0

    for item in items:
        try:
            handle(item)
            success += 1
        except Exception as exc:
            failure += 1
            # maybe DEBUG one representative error
            logger.debug("item_failed", error=str(exc), item_id=item.id)

    logger.info(
        "batch_processed",
        extra={"extra_fields": {
            "event": "batch_processed",
            "success": success,
            "failure": failure,
            "total": len(items),
        }},
    )
8. Structured Logs vs Metrics vs Traces
If you’re in Kubernetes and care about reliability, you should understand the split:
- Logs = detailed event history. Great for debugging single incidents.
- Metrics = numeric time series (latency, error rate, throughput). Great for alerts & SLOs.
- Traces = end-to-end request paths across services.
Structured logs bridge the gap:
- You can derive ad-hoc metrics from logs (e.g., count
event=payment_failed). - You can pivot traces/logs using
trace_idandspan_id. - You can debug weird edge cases metrics/traces can’t fully explain.
If you don’t have time for full OpenTelemetry yet, at least:
- Put
correlation_idin logs. - Standardize
eventnames. - Make logs JSON and parseable.
You’ll thank yourself later.
9. Common Pitfalls (That Will Bite You in Kubernetes)
Let’s be blunt about the usual failures:
- Mixing formats
Half your logs JSON, half plain text → parsing breaks, dashboards lie. - Logging in local time
Always log in UTC. Always. You’re in Kubernetes; your pods are everywhere. - Logging to files inside containers
Containers are ephemeral. Logs get lost, sidecars can’t see them, and you fight file paths. Use stdout/stderr. - Embedding stack traces as plain strings
Prefer structured traces (error.type,error.message,error.stack), or use library support. - No schema discipline
Today you loguser_id, tomorrowuserid, the next dayuserId. Your queries and dashboards become a joke. Pick a naming convention and enforce it.
10. Summary & Takeaways
If you’re running Python services on Kubernetes, structured logging is not a “nice to have”; it’s table stakes.
Key takeaways:
- Make every log line a JSON object with consistent fields.
- Use standard Python logging + JSON formatter or a library like structlog or loguru.
- In Kubernetes, log to stdout/stderr and let the platform/agent handle shipping.
- Always include correlation IDs for cross-service tracing.
- Be ruthless about log level discipline, sampling, and avoiding sensitive or massive data.
You don’t need a perfect observability stack to start. But you do need to stop treating logs as text blobs and start treating them as data.


Leave a Reply