Prometheus for Data Engineers: From Metrics to SLOs (Without Losing Your Mind)
Imagine this: your pipeline latency quietly doubles overnight. Dashboards still look “green enough,” but downstream teams start missing their own SLAs. By the time someone notices, you’re debugging blind across Airflow, Kafka, Spark, Snowflake… and you have no idea when things started going sideways.
Prometheus is how you stop flying blind.
For data engineers, Prometheus is more than “DevOps tooling” — it’s the backbone for measuring pipeline health, catching regressions early, and enforcing real SLOs on your data platform.
This article walks you from basic metrics → Prometheus models → PromQL → SLOs and alerts tailored for data engineering.
1. Why Prometheus Matters for Data Engineers
Data platforms are now:
- Distributed: Kafka, Flink/Spark, object storage, warehouses
- Always-on: batch, micro-batch, streaming, APIs
- Shared: dozens of teams relying on the same pipelines
You can’t manage this by “checking logs sometimes.” You need:
- Standardized metrics about jobs, latency, throughput, failures
- Queryable history (PromQL) to answer “when did this start?”
- SLOs that translate platform health into business guarantees
Prometheus gives you:
- A time-series database optimized for metrics
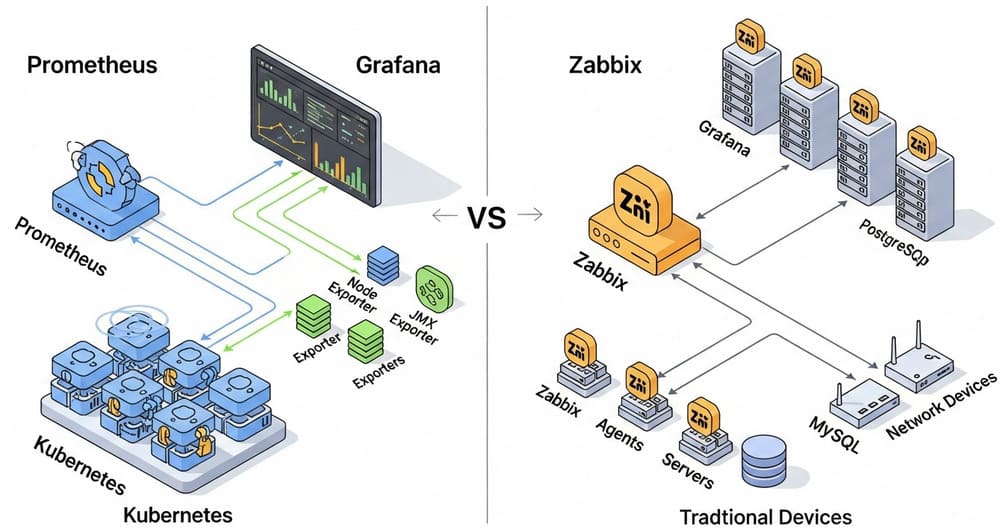
- A pull-based model (Prometheus scrapes targets)
- Service discovery (Kubernetes, static configs, etc.)
- PromQL for flexible analysis
- Integration with Alertmanager and Grafana
If you’re responsible for data pipelines in production, Prometheus is not optional anymore — it’s table stakes.
2. Prometheus Fundamentals (Through a Data Lens)
2.1 Core Concepts
- Metric: a named time series, e.g.
etl_job_duration_seconds - Labels: dimensions attached to metrics, e.g.
job="daily_sales",status="success" - Sample: a single
(timestamp, value)point - Target: something Prometheus scrapes (your job, exporter, service)
Prometheus stores data as time-series:
etl_job_duration_seconds{
  job_name="daily_sales",
  status="success",
  env="prod"
}
Each unique combination of labels is a separate time-series.
2.2 Metric Types You Actually Need
From a data engineer perspective, you’ll mainly use:
- Counter: monotonically increasing value (resets on restart)
- Perfect for: rows processed, errors, jobs run
- Gauge: value that can go up and down
- Perfect for: queue depth, lag, running tasks
- Histogram: observations bucketed into ranges
- Perfect for: job duration, request latency
- Summary: client-side percentiles (less common in data workloads; histograms + PromQL are more flexible)
3. Instrumenting Data Pipelines with Prometheus
Let’s make this concrete with a simple Python ETL job.
3.1 Basic Python Instrumentation
from prometheus_client import start_http_server, Counter, Histogram
import time
import random

# Metrics
ROWS_PROCESSED = Counter(
    "etl_rows_processed_total",
    "Total rows processed by ETL job",
    ["job_name", "env"]
)

JOB_DURATION = Histogram(
    "etl_job_duration_seconds",
    "Duration of ETL job in seconds",
    ["job_name", "env"],
    buckets=[5, 10, 30, 60, 120, 300, 600]
)

JOB_FAILURES = Counter(
    "etl_job_failures_total",
    "Total failed ETL runs",
    ["job_name", "env"]
)


def run_job(job_name: str, env: str = "prod"):
    start = time.time()
    labels = {"job_name": job_name, "env": env}

    try:
        # Fake work
        rows = random.randint(1000, 100000)
        time.sleep(random.uniform(5, 30))

        ROWS_PROCESSED.labels(**labels).inc(rows)
    except Exception:
        JOB_FAILURES.labels(**labels).inc()
        raise
    finally:
        duration = time.time() - start
        JOB_DURATION.labels(**labels).observe(duration)


if __name__ == "__main__":
    # Expose metrics on :8000/metrics
    start_http_server(8000)

    while True:
        run_job("daily_sales")
        time.sleep(300)
What this gives you:
etl_rows_processed_total{job_name="daily_sales", env="prod"}etl_job_duration_seconds_bucket{le="30", ...}etl_job_failures_total{job_name="daily_sales", env="prod"}
Prometheus just needs to be configured to scrape this process on /metrics.
4. PromQL for Data Engineers
Once metrics flow into Prometheus, PromQL turns them into useful answers.
4.1 Throughput: Rows per Minute
rate(etl_rows_processed_total{job_name="daily_sales", env="prod"}[5m])
This gives you rows per second over the last 5 minutes. Multiply by 60 for rows per minute.
You can use this to:
- Detect throughput drops
- Compare environments (
env="prod"vsenv="staging") - Visualize pipeline “shape” over a day
4.2 Failure Rate
rate(etl_job_failures_total{env="prod"}[1h])
- Alert if it goes above a threshold
- Compare failure rate per job with
by (job_name)
4.3 Job Duration (Histogram → Percentiles)
To get 95th percentile job duration over 24 hours:
histogram_quantile(
  0.95,
  sum by (le) (
    rate(etl_job_duration_seconds_bucket{job_name="daily_sales", env="prod"}[24h])
  )
)
This is where histograms shine: Prometheus can compute percentiles server-side across many instances and time windows.
5. From Metrics to SLOs
Metrics are noisy. SLOs are contracts.
An SLO (Service Level Objective) is a target for some reliability/quality metric over time, e.g.:
“99% of daily ETL jobs complete successfully within 30 minutes over 30 days.”
For data platforms, useful SLO dimensions:
- Freshness: “Data available by 7:00 AM for 99% of business days”
- Latency: “Streaming pipeline p99 end-to-end < 2 minutes”
- Success rate: “Job success > 99.5% over 7 days”
- Availability: “Warehouse query API available 99.9%”
5.1 Defining an SLO Using Prometheus Metrics
Example SLO:
“99% of daily_sales jobs must finish under 30 minutes over 30 days.”
You can define:
- Good events: job finished within 30 minutes
- Total events: all completed jobs
If you emit a metric etl_job_completed_total with a label slo_good="true|false":
sum(rate(etl_job_completed_total{slo_good="true", job_name="daily_sales"}[30d]))
/
sum(rate(etl_job_completed_total{job_name="daily_sales"}[30d]))
This yields the SLO attainment as a ratio (between 0 and 1).
Multiply by 100 in Grafana to show as percentage.
5.2 Error Budget Thinking
If your SLO is 99%, your error budget is:
- 1% of jobs may violate the 30-minute cap in a 30-day window
Prometheus + Alertmanager let you alert on burn rate, e.g.:
- “We’re burning the error budget too fast, even if SLO isn’t broken yet.”
Example: 4-hour window, alert if short-window SLO is far below target:
(
  sum(rate(etl_job_completed_total{slo_good="false"}[4h]))
/
  sum(rate(etl_job_completed_total[4h]))
)
> 0.02
This says “more than 2% of jobs in the last 4 hours failed the SLO” — a fast burn.
6. Best Practices for Data Engineers Using Prometheus
6.1 Model Your Metrics Like a Schema
Bad metrics are like bad schemas: painful forever.
Do:
- Use clear names:
etl_job_duration_seconds,kafka_lag_messages - Keep labels low-cardinality:
job_name,env,status,team - Avoid labels that explode:
user_id,file_name, rawtable_namefor 1000s of tables
Don’t:
- Put unbounded values in labels (
query_text,error_message) - Use one metric for everything like
data_metric{type="duration", ...}
6.2 Measure What Your Consumers Care About
SLOs must reflect business reality, not internals.
- Ops care about job success and rerun time
- Finance cares about data freshness for month-close
- Analytics cares about availability of critical tables/views
Translate that into metrics like:
dataset_freshness_seconds{dataset="sales_daily", env="prod"}dataset_availability{dataset="sales_daily", env="prod"}(0/1 gauge)
Then build SLOs on top of these.
6.3 Use Exporters Where Direct Instrumentation Is Hard
Not everything is your Python code.
Typical exporters for data platforms:
- Node exporter: host-level CPU, disk, memory
- Blackbox exporter: HTTP checks to APIs (e.g., query endpoints)
- Custom exporters: for warehouse query health, queue depth, object storage operations, etc.
For example, a custom exporter that:
- Runs a
SELECT COUNT(*)on a key table - Measures latency
- Emits
warehouse_query_duration_secondsandwarehouse_query_success_total
7. Common Pitfalls (And How to Avoid Them)
- Metric Explosion via Labels
- Problem: OOM in Prometheus, slow queries
- Fix: treat labels like indexes — intentional and limited
- Only Alerting on Infrastructure, Not Data
- Problem: Kubernetes is “healthy” while data pipeline is silently broken
- Fix: add semantic metrics: freshness, job counts, row counts by business unit
- No Ownership Defined for SLOs
- Problem: SLO breach and “everyone” is responsible → nobody acts
- Fix: each SLO has a clear owner team and escalation path
- SLOs That Are Unrealistic or Unenforced
- Problem: 99.999% targets for fragile batch jobs → alert fatigue
- Fix: start with realistic numbers (e.g., 95–99%), iterate using history
- Not Sampling or Aggregating Properly
- Problem: too high scrape frequency, noisy metrics, expensive PromQL
- Fix: reasonable scrape intervals (15–60s), use
rate()/sum()/ recording rules
8. How This Fits With the Rest of Your Stack
Prometheus is one piece of the picture. Typical data platform setup:
- Instrumentation in code: Python/Scala jobs emit Prometheus metrics
- Prometheus: scraping metrics, storing time-series
- Grafana: SLO dashboards, burn-down charts, incident views
- Alertmanager: routes alerts to Slack/Teams/PagerDuty
- Data catalog / docs: link datasets ↔ SLOs ↔ owners
Internal links you’d typically add around this article:
- “Intro to SLOs for Data Platforms”
- “Designing Reliable Data Pipelines with Airflow / Dagster”
- “How to Monitor Kafka, Spark, and Snowflake with Prometheus”
- “Building Data Freshness Dashboards in Grafana”
9. Conclusion & Key Takeaways
Prometheus is not just ops tooling — it’s how data engineers quantify reliability.
Key points:
- Instrument your pipelines with counters, gauges, and histograms.
- Use PromQL to derive throughput, latency, and failure rate.
- Define SLOs that reflect what your consumers actually care about (freshness, availability, latency).
- Implement error budgets and burn-rate alerts to catch issues early.
- Treat metric and label design like schema design — intentional and stable.
If your platform doesn’t have Prometheus-backed SLOs yet, don’t overthink it. Start with one critical pipeline, define a simple SLO (e.g., freshness + success rate), instrument it, and iterate.
Image Prompt
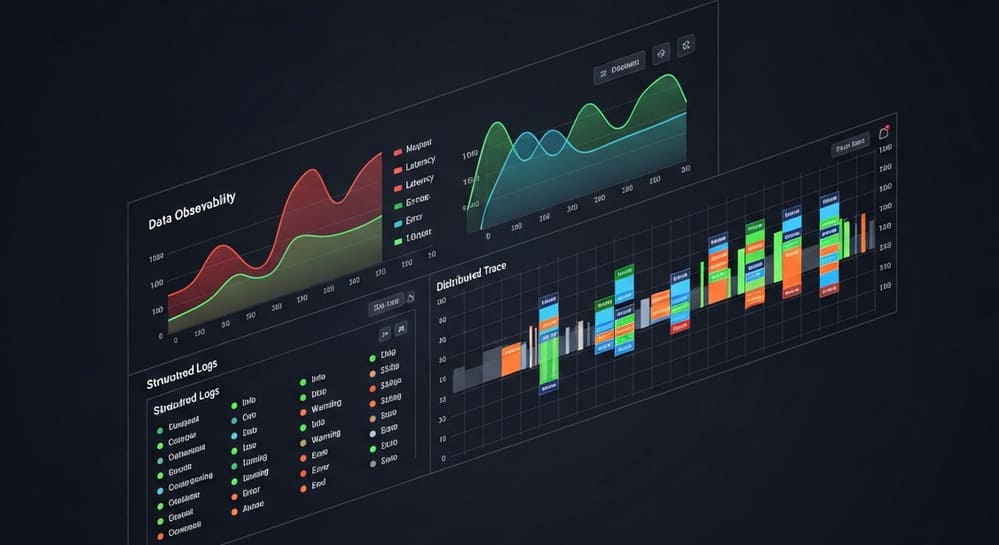
“A clean, modern observability dashboard for a data platform, showing Prometheus time-series graphs for ETL job latency, data freshness, and SLO burn rate — minimalist dark theme, high contrast, 3D isometric screens, subtle glow, engineering control room vibe.”




Leave a Reply