Monitoring 101 for Data Engineers: Metrics, Logs, Traces
If your pipeline breaks at 3 a.m. and the only signal you have is “job failed,” you don’t have monitoring — you have vibes. Monitoring is how you move from “something is wrong” to “I know exactly where and why it broke” before stakeholders start pinging you about missing dashboards.
This is your practical, no-BS guide to monitoring as a data engineer: metrics, logs, and traces — what they are, how they fit together, and how to use them without drowning in noise.
1. Why Monitoring Matters for Data Engineers
Modern data stacks are a mess (in a good way):
- ELT/ETL pipelines across Airflow / Dagster / Prefect
- Warehouses (Snowflake, BigQuery, Redshift)
- Lakes (S3, ADLS, GCS)
- Streaming (Kafka, Kinesis)
- Microservices and APIs feeding you data
When something breaks, business impact is immediate:
- Daily finance report is wrong → leadership decisions based on garbage
- Machine learning model uses stale data → degraded recommendations
- SLAs with partners → penalties or loss of trust
Monitoring for data engineers boils down to answering three questions quickly:
- Is the system healthy? (metrics)
- What exactly is happening? (logs)
- How did this request/job flow through the system? (traces)
If you wire these three right, you move from “panic and grep” to “observe, pinpoint, fix.”
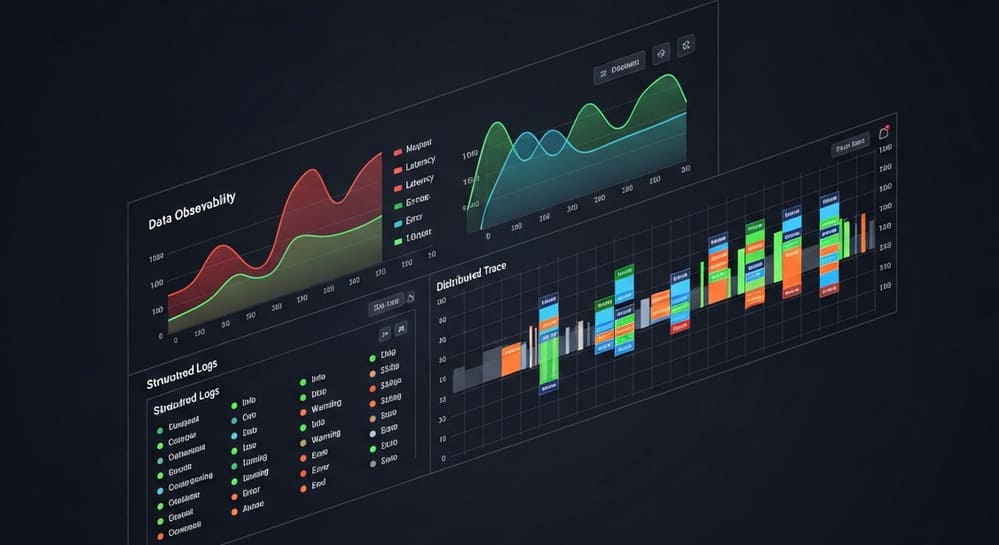
2. Metrics, Logs, Traces – The Core Concepts
Think of observability as three complementary camera angles on the same system.
2.1 Metrics – “How healthy is it?”
Metrics are numeric time-series — values sampled over time.
For data platforms, typical metrics:
- Pipeline level:
pipeline_run_countpipeline_failure_ratepipeline_latency_seconds(end-to-end)sla_breaches_total
- Data quality:
row_countnull_ratio_per_columnduplicate_keys_count
- Infra:
- CPU / memory / disk / I/O
- Connection pool usage
- Query latency
Metrics are:
- Cheap to store (aggregated, pre-computed)
- Great for dashboards and alerts
- Poor at explaining why something broke (they show symptoms)
2.2 Logs – “What exactly happened?”
Logs are structured (ideally) events over time.
For data engineers, logs should tell you:
- Which job/task ran
- Which dataset/table was touched
- Which upstream dependency or external system failed
- Which error message or exception occurred
Bad logs:
“Error occurred.”
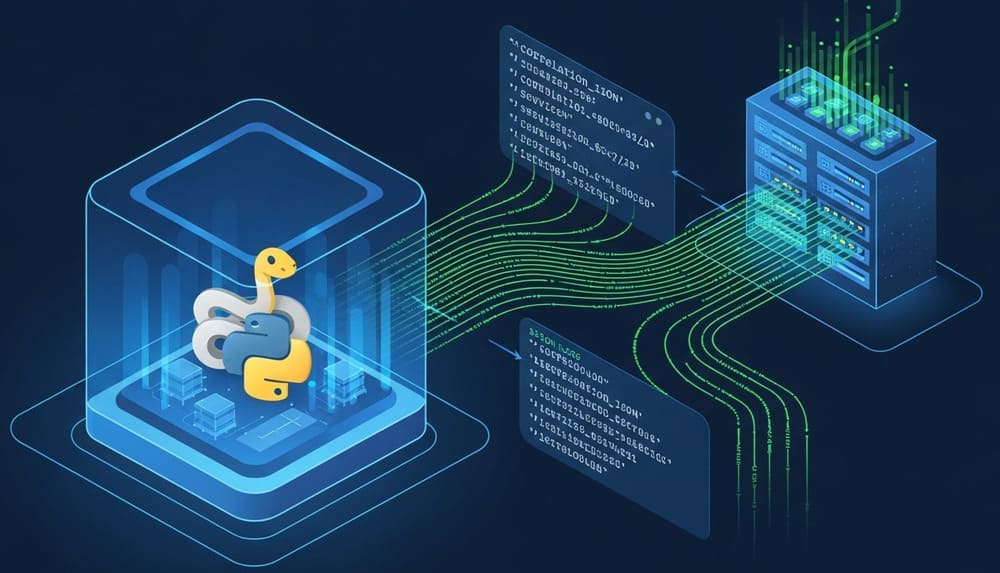
Good logs (structured JSON):
{
  "timestamp": "2025-11-26T02:14:03Z",
  "pipeline": "daily_orders_etl",
  "task": "load_to_warehouse",
  "run_id": "2025-11-26T02:00:00Z",
  "status": "FAILED",
  "error_type": "SnowflakeQueryError",
  "error_message": "Table ORDERS_RAW does not exist",
  "rows_processed": 0
}
Logs are:
- Detailed (can explain why)
- Expensive if unstructured and noisy
- Hard to query if you don’t enforce consistency
2.3 Traces – “How did this request/job flow?”
Traces show the path of a single “thing” (request, job, event) through multiple systems.
For data engineers, think:
- An API call → writes to Kafka → consumed by Spark job → written to Snowflake → triggered dbt model
- A scheduled DAG run → each task → downstream services and queries
Trace example (high level):
trace_id:abcd-1234span:api_ingest_order(100 ms)span:kafka_publish(50 ms)span:spark_transform_orders(120s)span:snowflake_load_orders_curated(30s)
Traces are:
- Gold for latency debugging and dependency analysis
- Underused in data teams compared to metrics/logs
- Best implemented with standards like OpenTelemetry
3. A Simple Monitoring Architecture for a Data Platform
Imagine a basic stack:
- Orchestrator: Airflow / Dagster / Prefect
- Warehouse: Snowflake / BigQuery / Redshift
- Storage: S3
- Transform: Spark / dbt
A pragmatic monitoring architecture:
- Emit metrics
- From orchestrator (task success/failure, duration, backlog)
- From jobs (row counts, null ratios, validation failures)
- From warehouse (query latency, queueing, credits usage if you can)
- Collect logs
- Standardize log format (JSON) from all jobs
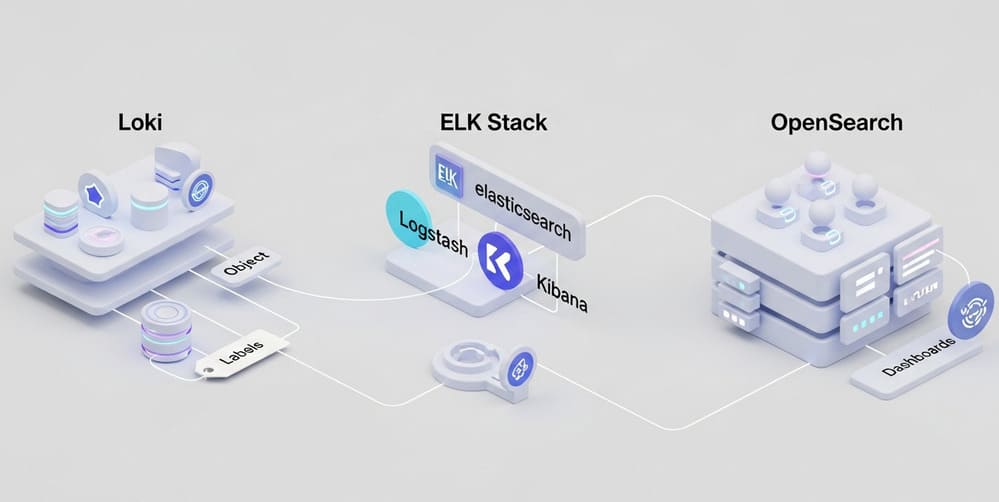
- Centralize in a log platform (e.g., Elasticsearch/OpenSearch, Loki, Cloud-native logging)
- Use consistent fields (
pipeline,task,run_id,dataset,status)
- Add traces (where feasible)
- Label everything with:
trace_id/run_id/correlation_id
- Use OpenTelemetry or similar to propagate IDs
- Trace a DAG run or streaming consumer pipeline end-to-end
- Label everything with:
- Visualize
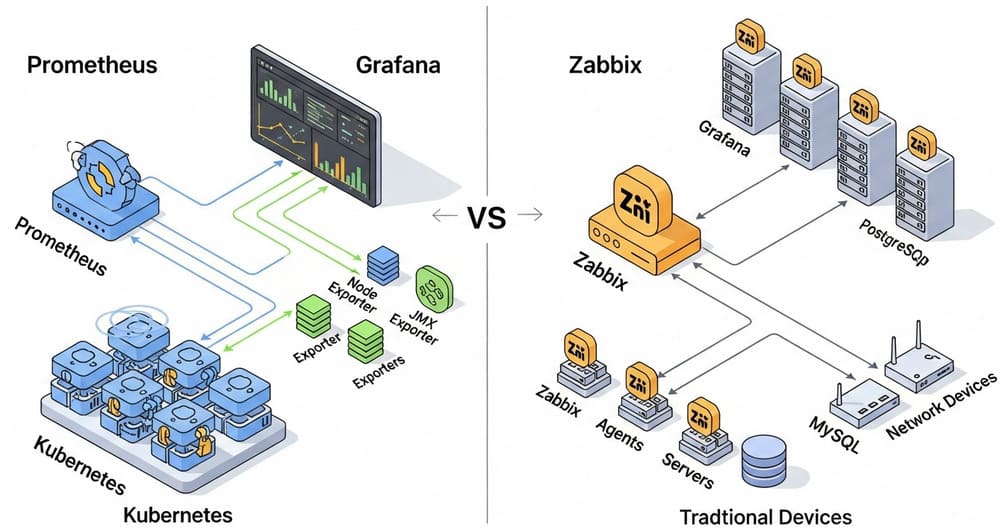
- Metrics → Grafana/Looker/BI dashboards
- Logs → Kibana/Grafana/Cloud console
- Traces → Jaeger/Tempo/Zipkin/vendor APM
4. Concrete Example: Instrumenting a Batch Pipeline
Let’s say you have a daily pipeline:
- Extract from API → S3
- Load from S3 → Snowflake stage table
- Transform stage → curated table
4.1 Metrics to track
Pipeline-level metrics:
pipeline_run_duration_seconds{pipeline="daily_orders"}pipeline_run_status{pipeline="daily_orders", status="success|fail"}rows_loaded{table="orders_stage"}rows_loaded{table="orders_curated"}
Data quality metrics:
null_ratio{table="orders_curated", column="customer_id"}duplicate_key_count{table="orders_curated", column="order_id"}
Snowflake/warehouse metrics (if available):
warehouse_query_duration_secondswarehouse_queue_time_secondscredits_usedper job (or warehouse utilization)
Pseudo-Python (Prometheus style):
from prometheus_client import Counter, Histogram, Gauge
import time

pipeline_duration = Histogram(
    "pipeline_run_duration_seconds",
    "Duration of pipeline run",
    ["pipeline"]
)

pipeline_status = Counter(
    "pipeline_run_status_total",
    "Pipeline run status",
    ["pipeline", "status"]
)

row_count_gauge = Gauge(
    "table_row_count",
    "Row count per table",
    ["pipeline", "table"]
)

def run_daily_orders():
    start = time.time()
    pipeline = "daily_orders"

    try:
        rows_stage = load_orders_stage()
        row_count_gauge.labels(pipeline=pipeline, table="orders_stage").set(rows_stage)

        rows_curated = transform_orders_curated()
        row_count_gauge.labels(pipeline=pipeline, table="orders_curated").set(rows_curated)

        pipeline_status.labels(pipeline=pipeline, status="success").inc()
    except Exception:
        pipeline_status.labels(pipeline=pipeline, status="fail").inc()
        raise
    finally:
        duration = time.time() - start
        pipeline_duration.labels(pipeline=pipeline).observe(duration)
This is bare-bones but already enough to:
- See failures per day
- See duration creep over time
- Compare row counts between steps
5. Logging for Data Pipelines (Without Going Insane)
5.1 Logging principles for data engineers
- Make logs structured
- JSON with consistent keys
- Easy to query:
pipeline,task,dataset,run_id,trace_id,status,error_type
- Log lifecycle stages
STARTED,IN_PROGRESS,COMPLETED,FAILED- For each task and for each dataset touch
- Don’t log raw sensitive data
- No full records with PII
- No access tokens, DB passwords, secrets
- Log context, not noise
- Key IDs, counts, boundaries, error summaries
- Avoid spamming debug logs in tight loops
5.2 Example: Good logging for a load task
import logging
import json
from datetime import datetime

logger = logging.getLogger("daily_orders")

def log_event(**kwargs):
    # simple helper to enforce structured logs
    base = {
        "timestamp": datetime.utcnow().isoformat(),
        "service": "data-pipelines",
    }
    base.update(kwargs)
    logger.info(json.dumps(base))

def load_to_snowflake(run_id: str, source_path: str, table: str):
    log_event(
        level="INFO",
        pipeline="daily_orders",
        task="load_to_snowflake",
        run_id=run_id,
        event="STARTED",
        source_path=source_path,
        target_table=table,
    )

    try:
        rows = do_copy_into_snowflake(source_path, table)

        log_event(
            level="INFO",
            pipeline="daily_orders",
            task="load_to_snowflake",
            run_id=run_id,
            event="COMPLETED",
            rows_loaded=rows,
        )
    except Exception as e:
        log_event(
            level="ERROR",
            pipeline="daily_orders",
            task="load_to_snowflake",
            run_id=run_id,
            event="FAILED",
            error_type=type(e).__name__,
            error_message=str(e)[:500],
        )
        raise
Now, in your log search you can query:pipeline:daily_orders AND task:load_to_snowflake AND event:FAILED
…instead of playing regex roulette on random text.
6. Traces for Data Workflows: When & How to Use Them
Traces are often introduced by platform/DevOps teams, but data engineers can benefit massively.
6.1 Where traces shine
- Complex DAGs with many dynamic tasks
- Systems mixing:
- streaming consumption
- microservices
- batch pipelines
- SLA-critical flows where you care where time is spent
Example scenario:
An order placed in the app should be visible in analytics within 2 minutes.
Trace this flow:
- API:
create_order→ emits event withtrace_id - Kafka: produces
orderstopic with sametrace_id - Spark streaming job: consumes; trace spans around batch micro-batches
- Warehouse load: final span logging write to analytics table
When the SLA is broken, you can answer:
- Is it stuck at the API, the topic, the consumer, or the warehouse?
6.2 Minimal tracing mindset without full-blown tools
Even if you don’t have Jaeger/Tempo/etc., you can:
- Generate a
trace_id/run_idat the start of a pipeline / request - Pass it through:
- logs
- metrics labels
- warehouse audit columns (
trace_id,run_id)
- Use this ID to correlate events manually
Example:
import uuid

def start_pipeline():
    run_id = uuid.uuid4().hex
    # use run_id in metrics labels, logs, and db audit columns
    return run_id
7. Best Practices & Common Pitfalls
7.1 Best practices
1. Start with SLOs, not tools
Decide what you care about:
- “95% of daily pipelines finish before 7:00 AM”
- “Streaming lag under 60 seconds for 99% of events”
- “No more than 1% of records fail data validation”
Then define metrics + alerts to match those.
2. Standardize observability fields
Use the same naming everywhere:
pipeline,task,job,dataset,run_id,trace_id,status,env- Agree on these across teams (or at least within your own)
3. Instrument only what you’ll use
- Start with:
- pipeline duration
- success/failure
- row counts per key table
- Add more after you’ve proven you actually look at the dashboards.
4. Use sampling
- For logs:
- Log full details on failures
- Sample or reduce logs on successful runs
- For traces:
- Sample a small % of traces for high-volume paths
5. Make alerts actionable
Bad alerts:
- “High CPU” with no context
- “Pipeline failed” without which one, how often, since when
Good alerts:
- “
daily_orderspipeline failed 3 times in the last hour in prod” - “Row count for
orders_curateddropped >20% vs 7-day average”
7.2 Common pitfalls
- Only monitoring infra, not data
- CPU is fine, but your table has 0 rows → still a failure
- Always include data-level metrics: row counts, quality checks
- No correlation IDs
- Logs, metrics, and tables don’t share a
run_id→ impossible to connect the dots
- Logs, metrics, and tables don’t share a
- Log noise
- Debug logs flooding every second → platform becomes unusable
- Fix by:
- log levels
- structured logs
- aggregation
- “Set it and forget it” dashboards
- Dashboards built once and never revisited
- Treat dashboards like code: review and refactor as systems evolve
- No drill-down path
- You see an alert but can’t quickly jump:
- Metric → relevant logs → related traces → warehouse records
- Design this flow intentionally.
- You see an alert but can’t quickly jump:
8. Putting It All Together: A Practical Monitoring Checklist
For a typical data platform, aim for this minimal baseline:
For each critical pipeline:
- Metric: run duration
- Metric: success/failure (with labels
pipeline,env) - Metric: key row counts (input and output tables)
- Log: structured logs with
pipeline,task,run_id,status - Log: errors with
error_typeand truncatederror_message - Optional: trace/run ID propagated into tables as audit columns
Platform-level:
- Dashboard: pipeline success rate over time
- Dashboard: pipeline duration trends
- Dashboard: data volume trends (row counts) for key tables
- Alerts on:
- repeated failures for the same pipeline
- large deviations in row counts or data quality metrics
- SLA breaches on critical jobs
If you have this in place, you’re already ahead of most teams.
9. Conclusion & Takeaways
Monitoring for data engineers isn’t about buying the flashiest tool; it’s about consistently answering:
- Is my data platform healthy?
- If not, where exactly is it broken?
- How quickly can I prove it’s fixed?
Metrics give you the health overview.
Logs give you the story and root cause.
Traces give you the end-to-end journey.
Start painfully simple:
- Instrument your most critical pipelines with:
- run duration
- success/failure
- row counts
- Introduce structured logs with a
run_id. - When things get more complex (streaming, microservices), bring in tracing.
You can always add more complexity. What kills teams is never starting or creating a noisy, unusable mess.
Internal Link Ideas (for your blog)
You can interlink this article with:
- “Data Quality Monitoring 101: From Row Counts to Contract Tests”
- “How to Design Reliable ETL/ELT Pipelines in Snowflake/BigQuery”
- “Intro to OpenTelemetry for Data Engineers”
- “Alert Fatigue: Designing Useful Alerts for Data Platforms”



Leave a Reply