Redash in 2026: The Open Source Data Visualization Tool That Won’t Break Your Budget
Introduction
Most companies need dashboards. Sales teams want revenue metrics. Product teams need user analytics. Operations teams track system performance.
The market offers plenty of options. Tableau costs thousands per user. Power BI locks you into Microsoft. Looker requires a team of specialists.
Redash takes a different approach. It’s open source, SQL-first, and surprisingly capable. You can self-host it for free or use the managed cloud version. Setup takes hours, not weeks.
This guide explains what Redash does well, where it falls short, and whether it’s the right choice for your team. You’ll learn how it compares to alternatives and when you should look elsewhere.
What is Redash?
Redash is a data visualization and dashboard tool built around SQL. You write queries, create visualizations, and share dashboards. That’s the core experience.
The project started in 2013. Arik Fraimovich built it because existing tools were too expensive or too complex. He open-sourced it, and the community grew. Databricks acquired it in 2020 but kept it open source.
The philosophy is simple. Most data people know SQL. Why force them to learn proprietary languages or drag-and-drop interfaces? Let them write SQL and turn results into charts.
Core Features
SQL-First Querying
Redash puts SQL front and center. You connect to your database, write a query, and run it. The results appear in a table. Then you pick a visualization type.
The SQL editor is basic but functional. It has syntax highlighting and autocomplete. You can parameterize queries with variables. Users can change those parameters without touching the SQL.
This approach has advantages. If you know SQL, you’re productive immediately. No training required. No proprietary query language to learn.
It also has limits. Complex analytics that need custom calculations or advanced transformations are harder. You’re constrained by what SQL can express cleanly.
Data Source Connectivity
Redash connects to dozens of data sources. All major databases work. PostgreSQL, MySQL, SQL Server, Oracle. Cloud data warehouses like Snowflake, BigQuery, and Redshift. NoSQL databases like MongoDB and Elasticsearch.
It also supports APIs and services. Google Analytics, Salesforce, Jira. You can query them alongside your databases.
Adding a data source takes minutes. You provide connection details, test the connection, and start querying. No complex integration work.
Visualization Options
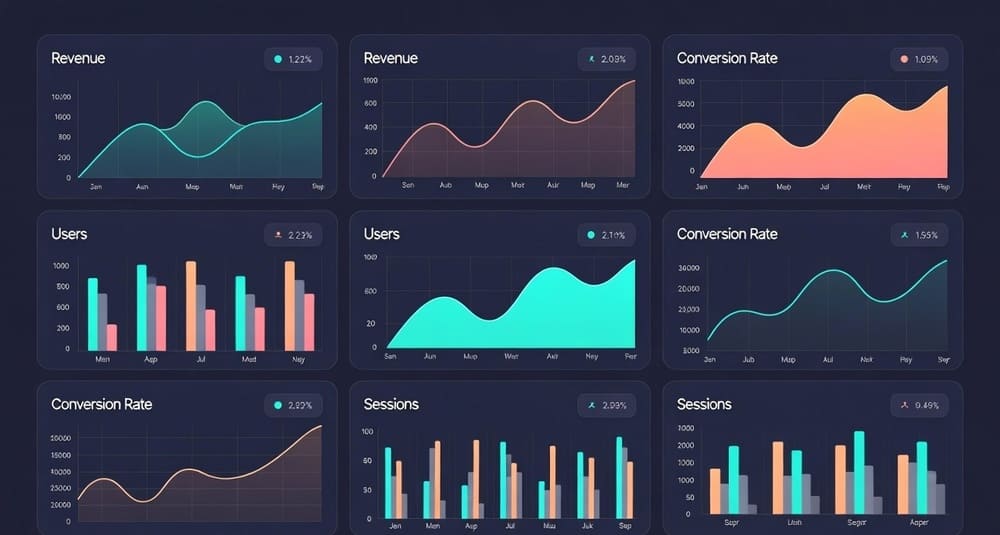
Redash offers standard chart types. Line charts, bar charts, pie charts, scatter plots. Tables with sorting and filtering. Counters for single metrics. Maps for geographic data.
The visualizations are functional, not beautiful. They’re clear and readable but won’t win design awards. You can customize colors, labels, and axes. Advanced customization requires editing JSON configuration.
For most business dashboards, the visualizations work fine. If you need pixel-perfect designs or complex interactive features, you’ll hit limits.
Dashboard Building
Dashboards combine multiple visualizations. You drag widgets onto a grid layout. Resize them, arrange them, add text boxes.
Dashboards can have parameters that filter multiple queries at once. A date range selector affects all charts. A dropdown for customer segment updates the entire dashboard.
Sharing is straightforward. Send a link, embed in an iframe, or set up scheduled email delivery. You can make dashboards public or restrict access.
Query Scheduling and Alerts
Queries can run on a schedule. Daily, hourly, or custom intervals. Results refresh automatically. Dashboards stay current without manual work.
Alerts monitor query results. When a value crosses a threshold, Redash sends notifications. Email, Slack, PagerDuty, webhooks. You define the condition and the destination.
This feature turns Redash into a monitoring tool. Track key metrics and get alerted when something breaks.
What Redash Does Well
Low barrier to entry. If you know SQL, you’re immediately productive. No courses, no certifications, no proprietary languages. Write a query, make a chart, share it.
Cost-effective. The open source version is free. Self-hosting costs whatever your infrastructure costs. The managed cloud version is affordable compared to commercial alternatives.
Quick setup. You can have Redash running in an afternoon. Docker makes deployment simple. Connect your databases and start building dashboards.
Flexible data sources. Connecting to multiple databases and services is easy. Query across different systems in the same dashboard.
Good for technical teams. Engineers and analysts who live in SQL feel at home. The tool doesn’t get in their way.
Active community. Being open source means community contributions, plugins, and shared knowledge. Help is available in forums and GitHub issues.
Where Redash Struggles
Limited for non-technical users. Business users who don’t know SQL can’t create their own queries. They’re dependent on technical team members.
Basic visualization options. The charts are functional but basic. Complex visualizations or highly customized designs aren’t possible without significant effort.
No data modeling layer. Unlike tools like Looker, Redash doesn’t have a semantic layer. You write raw SQL against tables. Business logic lives in queries, not in a shared model.
Performance at scale. Large result sets or complex queries can slow down. The tool doesn’t optimize query execution. Performance depends on your database.
Limited collaboration features. Version control for queries is basic. No branching, merging, or sophisticated change management. Teams working on the same queries can step on each other.
Governance challenges. Permissions are coarse-grained. Row-level security depends on database permissions. Tracking who queries what data requires external tools.
UI feels dated. The interface is functional but not modern. It hasn’t kept pace with contemporary design standards.
Common Use Cases
Internal analytics dashboards. Teams building dashboards for internal use find Redash sufficient. Sales dashboards, operational metrics, product analytics.
Startup and small company BI. Companies without budget for expensive tools use Redash. It covers basic needs without breaking the bank.
Engineering team metrics. DevOps teams tracking system performance, error rates, and infrastructure metrics. The SQL interface matches their workflow.
Ad hoc analysis. Analysts running exploratory queries benefit from the simple interface. Write SQL, see results, share findings.
Monitoring and alerting. Teams using Redash alerts to monitor business metrics. When orders drop, customer churn spikes, or systems slow down, alerts fire.
Multi-database querying. Organizations with data spread across multiple databases use Redash to query everything in one place.
Redash vs. Alternatives
Redash vs. Tableau
Tableau is the enterprise standard. It’s powerful, polished, and expensive.
Tableau has better visualizations, drag-and-drop analysis, and advanced features. It’s designed for business users. The downside is cost and complexity. Licenses run thousands per user. Setup and training take weeks.
Redash is simpler and cheaper. Visualizations are basic, but they work. You need SQL skills. For technical teams with budget constraints, Redash wins.
Redash vs. Power BI
Power BI integrates deeply with Microsoft’s ecosystem. If you’re using Office 365, Azure, and SQL Server, it’s a natural fit.
Power BI has better visualizations than Redash. It has a data modeling layer and more features. But it locks you into Microsoft. The licensing model can get expensive.
Redash is database-agnostic and open source. Better for teams not committed to Microsoft or those wanting more flexibility.
Redash vs. Metabase
Metabase is Redash’s closest competitor. Both are open source, SQL-friendly, and aimed at similar users.
Metabase has a friendlier UI. It offers a query builder for non-SQL users. The visualization options are slightly better. Setup is similarly easy.
Redash has more data source connectors. Its query parameters are more flexible. The community is larger and more active.
The choice often comes down to preference. Try both and see which feels better for your team.
Redash vs. Looker
Looker is enterprise BI with a semantic modeling layer. You define business logic once in LookML. Users query the model, not raw tables.
Looker is more powerful for large organizations. It handles governance, complex data models, and self-service for business users. It’s also much more expensive and complex to set up.
Redash is simpler and faster. For teams that don’t need a semantic layer, Redash is plenty.
Redash vs. Superset
Apache Superset is another open source option. It came from Airbnb and joined the Apache Foundation.
Superset has more visualization types and better interactivity. It has a SQL Lab for query development and a semantic layer for business users.
Superset is more complex to set up and operate. It requires more infrastructure. Redash is lighter weight and easier to get started with.
Teams wanting more features lean toward Superset. Teams wanting simplicity prefer Redash.
Redash vs. Grafana
Grafana is built for time-series data and monitoring. It excels at system metrics, application performance, and infrastructure monitoring.
Grafana is better for operational dashboards. Real-time metrics, alerting, and integrations with Prometheus, InfluxDB, and similar tools.
Redash is better for business analytics. SQL queries against traditional databases. Less real-time, more analytical.
Many teams use both. Grafana for infrastructure monitoring, Redash for business metrics.
Self-Hosting vs. Cloud
Redash offers two deployment options. Self-host the open source version or use their managed cloud service.
Self-Hosting
Self-hosting gives you complete control. You own the infrastructure and data. Customization is unlimited. Costs are just your server expenses.
The downside is operational responsibility. You handle updates, backups, scaling, and security. If you have DevOps resources, this is manageable. If you don’t, it’s a burden.
Docker makes deployment easier. Official images exist. Community guides walk through setup on AWS, GCP, Azure, and Kubernetes.
Managed Cloud
The managed service removes operational work. Redash handles updates, backups, and scaling. You focus on building dashboards.
Pricing is per user. It’s affordable compared to commercial tools but costs more than self-hosting if you have cheap infrastructure.
The managed version makes sense for small teams without DevOps resources. Or for teams that value time over cost.
Getting Started with Redash
Starting with Redash is straightforward. Here’s the basic process.
Deploy Redash. Use Docker for self-hosting or sign up for the cloud version. Configuration takes minutes, not hours.
Connect data sources. Add your databases. Provide connection strings and credentials. Test connections to make sure everything works.
Write your first query. Open the query editor. Select a data source. Write SQL. Run it. Results appear in seconds.
Create a visualization. Pick a chart type from the results. Configure it. Adjust labels, colors, and formatting.
Build a dashboard. Create a new dashboard. Add your visualizations. Arrange them on the grid. Add parameters for filtering.
Share with your team. Set permissions. Send links. Set up scheduled refreshes. Create alerts if needed.
The learning curve is gentle. If you know SQL, you’re productive in hours.
Best Practices
Keep queries simple. Complex SQL is hard to maintain. Break big queries into smaller pieces. Use views or temp tables in your database.
Use query parameters wisely. Parameterized queries let users explore data. But too many parameters confuse people. Start with one or two key filters.
Optimize database performance. Redash runs whatever SQL you give it. Slow queries make slow dashboards. Add indexes, optimize joins, limit result sizes.
Document your queries. Add descriptions explaining what each query does. Future you will appreciate it. So will your teammates.
Set reasonable refresh schedules. Don’t refresh every minute if daily is enough. Unnecessary queries waste database resources.
Organize dashboards logically. Create folders. Use naming conventions. Make it easy to find relevant dashboards.
Control access carefully. Not everyone needs access to everything. Set permissions appropriately. Protect sensitive data.
Monitor alert noise. Too many alerts and people ignore them. Set thresholds carefully. Test before enabling.
Extending Redash
Redash is extensible. The open source nature means you can customize it.
Custom visualization types can be added. If you know JavaScript, you can build new chart types. Community members have shared custom visualizations.
Data source plugins let you connect to systems Redash doesn’t support out of the box. The plugin architecture makes this possible without forking the codebase.
API access lets you integrate Redash with other tools. Trigger queries, fetch results, manage dashboards programmatically.
Webhooks send data to external systems. Query results, alert notifications, user actions. Build integrations with your existing tools.
The extensibility matters most for larger deployments. Small teams rarely need custom development.
When to Choose Redash
Redash is a good fit in specific situations.
You have a technical team. If your users know SQL, Redash is great. They can build what they need without depending on others.
Budget is limited. The open source version costs nothing beyond infrastructure. Even the managed version is affordable.
Simple dashboards are enough. If you need standard charts showing business metrics, Redash delivers.
You value speed of deployment. Getting started takes hours, not weeks. You can be productive immediately.
Data governance is straightforward. If your security requirements are basic, Redash’s permissions work fine.
You want flexibility. Open source means you can customize, extend, or migrate away without vendor lock-in.
When to Look Elsewhere
Redash isn’t right for everyone.
Non-technical business users need self-service. If your users don’t know SQL and won’t learn, they need something with a query builder or semantic layer.
You need advanced visualizations. Complex interactive charts, custom designs, or sophisticated analytics features aren’t Redash’s strength.
Governance is critical. Large enterprises with complex data access rules need more sophisticated tools.
You’re deeply invested in a cloud ecosystem. If you’re all-in on AWS, Azure, or GCP, their native tools might integrate better.
Real-time dashboards are required. Redash refreshes on schedules. True real-time streaming dashboards need different tools.
You need a semantic layer. Defining business logic once and letting everyone query it requires tools like Looker or dbt with a BI layer on top.
The Future of Redash
Redash development continues under Databricks. Updates come regularly. The community remains active.
The tool is stable and mature. Don’t expect massive feature additions. Expect steady improvements, bug fixes, and maintenance.
The open source model means it won’t disappear. Even if official development slowed, the community could continue.
For teams using it today, Redash will keep working. The fundamentals are solid. SQL isn’t going anywhere.
Key Takeaways
Redash is a practical choice for data visualization. It’s not fancy, but it works.
The SQL-first approach is both its strength and limitation. Technical teams love it. Non-technical users struggle.
Cost and simplicity are major advantages. Free to use, quick to deploy, easy to understand.
The visualization options are basic but sufficient for most business dashboards. Advanced needs require different tools.
Self-hosting gives control and low costs. Managed service removes operational burden.
Redash fits technical teams with limited budgets. It’s good for internal analytics, monitoring, and ad hoc analysis.
It’s not right for self-service business intelligence or highly governed enterprise environments. Know your requirements before choosing.
For many teams, Redash hits the sweet spot. Powerful enough to be useful, simple enough to actually use.
Tags: Redash, data visualization, open source BI, SQL dashboards, business intelligence, data analytics, dashboard tools, self-hosted analytics, Redash vs Tableau, Redash vs Metabase, SQL-first visualization, analytics tools, data visualization tools, BI platforms, dashboard software


