Zabbix Monitoring for Data & Platform Engineers: From “Is It Up?” to Real Observability
If you’ve ever been paged at 3 a.m. because “the pipeline is slow” and had no idea where to look first, Zabbix is one of the tools that can save your sanity. It’s an open-source monitoring platform that can watch your servers, databases, network, cloud, and even business KPIs — all in one place — if you use it correctly. (Zabbix)
This article walks through how Zabbix works, how it fits into a modern data platform, and what to do (and avoid) when you deploy it.
What Is Zabbix and Why Should Data Engineers Care?
Zabbix is an enterprise-grade, open-source monitoring and observability platform. It collects metrics from IT infrastructure — servers, VMs, containers, databases, applications, network devices, and cloud services — and lets you visualize them, define alerts, and automate responses. (Zabbix)
Key points for data / platform engineers:
- End-to-end view: One system for host health, database metrics, network, and application checks.
- Rich data collection: Agents, SNMP, HTTP checks, JMX, IPMI, cloud integrations, and more. (Zabbix)
- Open-source, no license cost: You pay in architecture, ops, and tuning instead of per-host or per-metric fees. (Wikipedia)
- Scales to large fleets with server + proxy architecture (hundreds of thousands of monitored endpoints in real deployments). (Zabbix)
If you’re responsible for data pipelines or analytics platforms, Zabbix can be the layer that catches:
- Disk filling up on a warehouse node.
- Lag creeping up on a Kafka consumer.
- ETL node CPU thrashing because of a bad Spark job.
- Latency spikes on the internal API feeding dashboards.
Zabbix Architecture in 5 Minutes
At a high level, Zabbix looks like this:
Agents / checks → Proxy (optional) → Server → Database → Web frontend / API
Core Components
| Component | Role (for you) |
|---|---|
| Zabbix Server | Core engine: receives metrics, evaluates triggers, generates events/alerts, writes to DB. (Zabbix) |
| Database | Stores configuration, history, trends, events. Supports MySQL, PostgreSQL, Oracle, etc. (Zabbix) |
| Web Frontend | PHP UI for configuration, dashboards, maps, graphs, and basic reporting. (Zabbix) |
| Agent | Lightweight daemon on hosts collecting OS/app metrics; supports custom user parameters. (DeepWiki) |
| Proxy | Optional “satellite” collector for remote sites or big fleets; buffers data and forwards to server. (DeepWiki) |
| API | JSON-RPC API for automation, CI/CD integration, and dynamic discovery. (DeepWiki) |
How data flows:
- Agents / checks collect metrics (CPU, disk, query latency, HTTP status, etc.).
- Proxy (optional) aggregates metrics from a region/datacenter and sends batches to the server.
- Server writes raw metrics to history tables, aggregates to trends, and evaluates triggers.
- Events fire when triggers change state; actions send notifications or run remediations.
- You inspect everything via dashboards, graphs, maps, and screens in the web UI.
Think of Zabbix as a central nervous system for your infra: agents are sensors, proxies are spinal cord segments, the server is the brain, and the UI/API is your “consciousness.”
Key Concepts: How Zabbix Thinks About Monitoring
To use Zabbix effectively, you need to speak its language. The important concepts:
- Host – A monitored entity: server, VM, switch, Kubernetes node, database instance, etc.
- Item – One metric on a host (e.g.,
system.cpu.util,vfs.fs.size[/,free],pgsql.connections). (NewServerLife) - Trigger – An expression that defines a problem state, e.g., “CPU > 85% for 5 minutes.”
- Event – A state change raised when a trigger goes from OK→PROBLEM or PROBLEM→OK.
- Action – What to do when events occur: send email/Slack, create ticket, run script.
- Template – Reusable bundle of items, triggers, graphs, and discovery rules.
- Low-Level Discovery (LLD) – Dynamic discovery of entities (filesystems, interfaces, DBs, etc.) and auto-attaching item/trigger prototypes.
- Macro – A variable you can override per host or template (
{$DISK_WARN},{$DB_PORT}).
Once you grasp Host → Items → Triggers → Actions, the rest is variations on a theme.
Real Example: Monitoring a Data Pipeline Node with Zabbix
Let’s walk through a concrete example you’d actually care about as a data/platform engineer.
Scenario
You have an ETL node running:
- PostgreSQL for metadata.
- Airflow / custom schedulers for jobs.
- Dockerized data services.
You want to monitor:
- CPU, RAM, disk usage.
- PostgreSQL connection count and replication lag.
- Job failures or backlog size (via custom checks).
Step 1 – Install Zabbix Agent on the ETL Node
On most Linux distros you can use the official repository packages (simplified):
# Example (not exact for every distro)
sudo apt update
sudo apt install zabbix-agent

# In /etc/zabbix/zabbix_agentd.conf
Server=10.0.0.10               # Zabbix server or proxy
Hostname=etl-node-01
Include=/etc/zabbix/zabbix_agentd.d/
Restart the agent and make sure it can reach the server/proxy.
Step 2 – Attach OS and PostgreSQL Templates
In the Zabbix UI:
- Create host
etl-node-01. - Assign templates such as:
Template OS Linux by Zabbix agentTemplate DB PostgreSQL by Zabbix agent(or community template)
This immediately gives you:
- CPU, load, memory, disk, network items.
- PostgreSQL metrics like active connections, cache hit ratio, replication state.
Step 3 – Add a Custom UserParameter for ETL Lag
Suppose you write a small script that outputs “pipeline lag in seconds” by comparing latest processed timestamp in a table vs current time.
/usr/local/bin/etl_lag_seconds.sh
#!/usr/bin/env bash
psql "$PG_DSN" -tAc "
  SELECT EXTRACT(EPOCH FROM (NOW() - MAX(processed_at)))::int
  FROM etl.job_runs;
"
Make it executable:
chmod +x /usr/local/bin/etl_lag_seconds.sh
Now extend the agent config:
# /etc/zabbix/zabbix_agentd.d/etl.conf
UserParameter=etl.lag_seconds,/usr/local/bin/etl_lag_seconds.sh
Restart the agent. In Zabbix, create an item:
- Key:
etl.lag_seconds - Type: Zabbix agent
- Units:
s - Update interval:
60s
Step 4 – Define Triggers for Real Problems
Example triggers:
- Disk space:
/free space < 15% for 5 minutes. - DB connections: Connections > 80% of max.
- ETL lag:
{etl-node-01:etl.lag_seconds.min(10m)}>600
Meaning: if the minimum lag in the last 10 minutes is > 600 seconds (10 minutes), fire an alert.
Tie these to an action that sends Slack or email to the on-call group.
Now you have actionable, pipeline-specific monitoring — not just “is the host up?”.
Zabbix vs Prometheus/Grafana: Where It Fits
Blunt truth: if you’re already invested heavily in Prometheus + Alertmanager + Grafana, you don’t need Zabbix for metrics. But there are reasons teams still pick it:
Zabbix strengths
- All-in-one: collection, storage, alerts, dashboards, and maps in a single product. (Zabbix)
- Strong built-in UI for non-SRE teams (ops, NOC, DBAs).
- Very good at remote site monitoring via proxies (branch offices, factories, client environments).
- SNMP and “traditional infra” monitoring is first-class.
Where Prometheus/Grafana win
- Cloud-native metric model with labels.
- Pull-based scraping for containerized microservices.
- Strong ecosystem for exporters and SLO-style monitoring.
For many orgs, the pragmatic answer is:
- Prometheus for app/service metrics.
- Zabbix for infra, network, legacy, branch sites — and sometimes business KPI checks.
Best Practices for Using Zabbix in Data & Analytics Platforms
Here’s the part most teams get wrong. Installing Zabbix is easy. Designing useful monitoring is not.
1. Start from Questions, Not from Metrics
Bad: “Collect all CPU, memory, disk, and network metrics on every host.”
Better: “What questions do we need to answer quickly?”
- Are my critical pipelines meeting SLAs?
- Can we ingest today’s data volume without running out of disk?
- Is the warehouse cluster overloaded during business hours?
Design items and triggers around these questions, then add low-level system metrics as supporting detail.
2. Use Templates and Macros Aggressively
- Create templates per role:
Template Data Warehouse NodeTemplate Kafka BrokerTemplate Airflow Worker
- Put common triggers/items in templates, and override via macros (e.g.,
{$DISK_WARN},{$CPU_HIGH}) per host group.
This keeps your configuration maintainable as the platform grows.
3. Segment with Proxies for Scale and Isolation
If you’re monitoring:
- Multiple data centers,
- Customer environments,
- Or “dirty” networks,
Use Zabbix proxies:
- Reduce load on the central server.
- Store data locally if links are flaky, then forward later.
- Isolate security zones (proxy inside the protected network, server in core). (DeepWiki)
4. Tune History and Trends
Metric retention can kill your DB if you ignore it.
- History (raw values) for fast graphs & alerting: keep detailed data for days/weeks.
- Trends (aggregated) for long-term: keep months/years for capacity planning. (Hawatel)
Align retention with real needs:
- Do you actually need per-second CPU data from 6 months ago? Probably not.
- Do you need long-term rollups of daily max disk usage? Yes.
5. Harden and Automate
- Restrict access to the frontend/API (RBAC, strong auth).
- Ensure time sync (NTP) across all components — timestamps matter.
- Use the API for:
- Onboarding new hosts from CI/CD.
- Applying templates automatically.
- Managing macros and maintenance windows. (DeepWiki)
Common Pitfalls (And How to Avoid Them)
Let’s be brutally honest about what usually goes wrong.
1. “Monitor Everything” → Useless Noise
- Thousands of triggers firing constantly = people mute email/Slack.
- Alert rules that nobody ever tunes.
Fix: Define a small, high-value alert set first (disk, DB, key KPIs), then expand gradually. Review noisy triggers weekly.
2. Overloading the Zabbix Database
- Too frequent polling (e.g., every 5s for everything).
- Too many items per host with no retention strategy.
Fix:
- 30–60s for critical metrics, 1–5 min for less important ones.
- Use housekeeping + history/trend split properly.
- Move DB to a solid, tuned instance (PostgreSQL/MySQL) with good I/O. (Zabbix)
3. Ignoring Visualization
If your team only ever sees plain text email alerts, you’re wasting Zabbix.
- Build dashboards for:
- ETL health (lag, failures, queue size).
- Warehouse usage (CPU, I/O, queries).
- Kafka/streaming health.
Use these dashboards in stand-ups, incident reviews, and postmortems, not just emergencies.
4. Treating Zabbix as a “One-Time Install”
Zabbix is not “fire and forget.”
- New services → new templates and items.
- New SLAs → new triggers.
- New incidents → new checks.
If your platform evolves but your monitoring doesn’t, you will get blindsided.
Conclusion: Zabbix as Your Data Platform’s Early Warning System
Zabbix won’t magically fix bad pipelines or broken schemas. But if you design it around clear questions, good templates, and sane alerting, it becomes:
- Your early warning system for data platform incidents.
- A source of truth for infra health and capacity trends.
- A bridge between traditional infra monitoring and modern data engineering.
For a data engineer, that means fewer blind outages, faster root cause analysis, and more time spent improving systems instead of firefighting them.
Key takeaways:
- Understand the core components: server, DB, frontend, agents, proxies.
- Model monitoring around hosts → items → triggers → actions.
- Start from business and pipeline questions, then define metrics.
- Use templates, macros, and proxies to keep things manageable.
- Treat Zabbix as a living system that evolves with your platform.
More Read:
- “Monitoring 101 for Data Engineers: Metrics, Logs, Traces”
- “Prometheus vs Zabbix: Choosing a Monitoring Stack for Your Data Platform”
- “Designing SLIs and SLOs for Data Pipelines”
- “Alert Fatigue: How to Design Alerts People Don’t Ignore”
- “Capacity Planning for Data Warehouses and Lakehouses”
Image Prompt (for DALL·E / Midjourney)
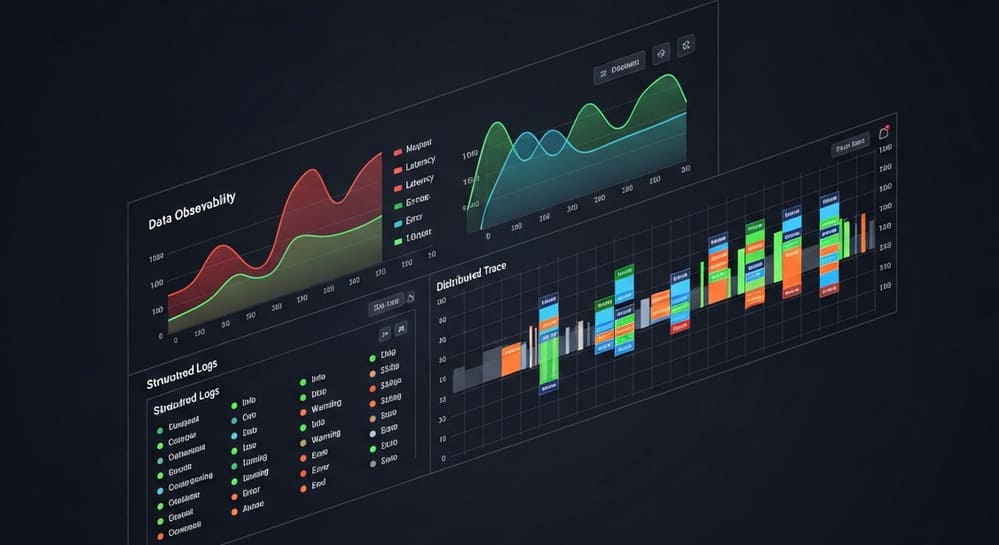
“A clean, modern observability dashboard showing a Zabbix-style monitoring architecture: central server, proxies, agents on servers and databases, with metrics, alerts, and graphs connected across a distributed infrastructure — minimalistic, high contrast, 3D isometric style.”
Tags
Zabbix, Monitoring, Observability, DataEngineering, DevOps, Infrastructure, OpenSource, Alerting, Dashboards, CapacityPlanning


