Splunk for Data Engineers: From “Log Dumpster” to Searchable Observability Platform
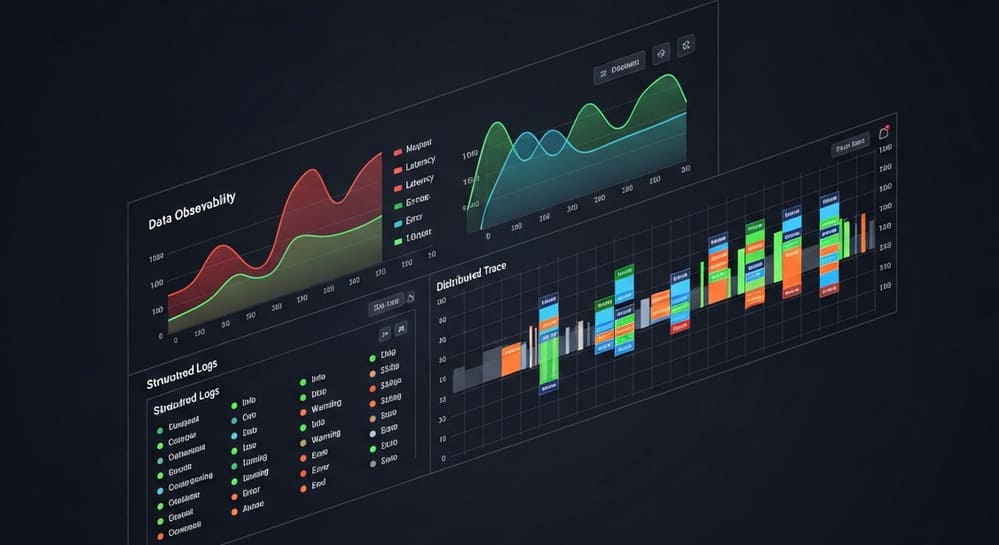
If you’ve ever tailed 12 different log files over SSH at 3 a.m., Splunk is basically the grown-up version of what you wish you had: a distributed system that eats logs, metrics, and events and lets you search, alert, and dashboard them at scale.(Cloudian)
This guide is a data-engineer-friendly tour of Splunk: architecture, data modeling, search, and the real best practices nobody explains in the marketing docs.
1. What Splunk Actually Is (and Why You Should Care)
Short version: Splunk is a distributed log and event analytics platform. It:
- Collects data from apps, infra, security tools, SaaS, etc.
- Indexes that data into buckets for fast search.(Splunk Docs)
- Lets you query it with SPL (Search Processing Language) to power dashboards, alerts, and investigations.
Common use cases for data engineers:
- Centralized application logging for microservices.
- Pipeline & job monitoring (Airflow, Spark, Kafka, Snowflake, etc.).
- Security and audit trails (especially with Splunk Enterprise Security).
- User behavior analytics for product and growth teams.
Think of it as: “ELK on steroids + enterprise support + rich ecosystem.”
2. Splunk Architecture in Plain English
Splunk is fundamentally a distributed search system with a few standard roles.(Splunk Docs)
2.1 Core Components
| Component | What it does (conceptually) | What you care about as DE |
|---|---|---|
| Forwarder | Lightweight agent that ships data to indexers. | Installed on servers, configured inputs, load balancing. |
| Indexer | Parses events, creates indexes & buckets, stores raw+tsidx. | Index design, retention, performance, cluster sizing. |
| Search Head | UI + API where searches run; fans out queries to indexers. | Apps, dashboards, saved searches, role-based access. |
| Cluster Manager | Orchestrates indexer cluster & replication. | Replication factor & site awareness in larger deployments. |
Splunk’s own docs summarize the “big three” as forwarder → indexer → search head.(edureka.co)
2.2 The Data Pipeline
Roughly:
- Data input
- Forwarders (or HEC, Kafka, Kinesis, etc.) send events into Splunk.(Splunk)
- Parsing & indexing
- Indexers break data into events, extract timestamps, apply sourcetypes, and store it in buckets (directories that hold raw data and index files).(Splunk Docs)
- Search & reporting
- Search heads issue SPL searches; indexers scan buckets and return matching events; search head merges and presents results.(Splunk Docs)
Mentally, map it to a data warehouse:
- Forwarder ≈ ingestion tool
- Indexer ≈ storage + query engine node
- Search head ≈ BI tool / query coordinator
3. Data Modeling in Splunk: Indexes, Sourcetypes, and Data Models
If you treat Splunk as a “dump everything and grep later” system, you’ll burn money and CPU. Data modeling is where data engineers earn their paycheck.
3.1 The Fundamentals
- Index – Logical & physical namespace for data (like a database).
- Used for security boundaries, retention policies, and performance.
- Sourcetype – Describes the shape of events (schema-ish).
- Defines how events are parsed, timestamps extracted, and fields auto-extracted.
- Fields – Key-value pairs in events (like columns).
- Some are indexed, others are extracted at search time.
- Data Models – Logical, normalized views on top of raw events.
- Used heavily by apps like Enterprise Security and CIM.
3.2 Data Model Acceleration
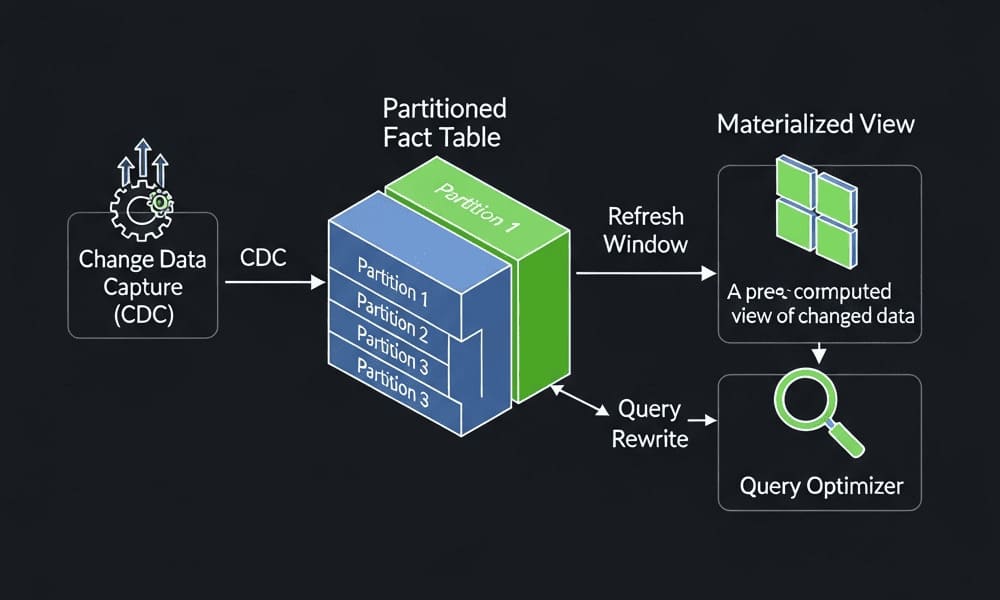
Data models can be accelerated: Splunk builds summary .tsidx files per index bucket for each accelerated model, creating a “high performance analytics store” that makes pivots and cards much faster.(Splunk Documentation)
Key idea: accelerated data models trade disk + CPU for fast read-heavy analytics, similar to materialized views.
4. SPL: How You Actually Use Splunk
SPL is a search language optimized for log/event analytics. Basic flow:
index=app_logs sourcetype=nginx_access
| stats count as requests,
        sum(case(status>=500,1,0)) as errors
        by service, host
| eval error_rate = round(errors / requests * 100, 2)
| sort - error_rate
What’s happening:
index=app_logs sourcetype=nginx_access
→ Use index and sourcetype to narrow the search early (huge performance win).stats
→ Aggregation, likeGROUP BYin SQL.eval
→ Expression language for computed fields.sort
→ Final ordering for dashboards or investigations.
For a data engineer, SPL is SQL-ish but pipeline-oriented, like a mashup of SQL, Unix pipes, and Pandas.
5. Real Example: Observability for a Microservices Platform
Imagine:
- 50+ microservices in Kubernetes
- Nginx ingress, app logs, and job logs from Spark, Airflow, and Snowflake loads
- You want: error rates, slow endpoints, and job failures in one place
5.1 Ingestion Design
- Indexes
infra_logs– hosts, containers, Kubernetes, ingress.app_logs– application logs (business logic).data_jobs– ETL/ELT jobs (Airflow, Spark, dbt, Snowflake).
- Sourcetypes
kube:containernginx:accesspython:appairflow:task
You configure forwarders or HEC endpoints on the cluster nodes; they send logs with correct sourcetypes and indexes.
5.2 Typical Queries
Top failing endpoints in last 15 minutes
index=app_logs sourcetype=nginx_access earliest=-15m
status>=500
| stats count as error_count by service, path
| sort - error_count
Airflow task failure rate per DAG
index=data_jobs sourcetype=airflow:task earliest=-24h
| stats count as total,
        sum(case(state="failed",1,0)) as failed
        by dag_id
| eval fail_rate = round(failed / total * 100, 2)
| sort - fail_rate
This is where Splunk shines: multi-source, cross-cutting investigations (infra + app + data jobs) in one place.
6. Best Practices (and Classic Pitfalls)
6.1 Architecture & Scaling
Do:
- Use forwarders + distributed indexers + search head cluster for medium/large environments.(Splunk Docs)
- Adopt a Validated Architecture instead of inventing your own snowflake topology.(Splunk)
- Separate tiers (data collection, indexing, search) for resilience and easier scaling.
Don’t:
- Run everything on one big all-in-one Splunk box in production.
- Mix search head and indexer roles on the same machine at scale.
6.2 Index & Sourcetype Strategy
Do:
- Design indexes based on:
- Retention (e.g., 90 days app logs, 365 days security logs)
- Security (who can see what data)
- Performance / workload (high-volume vs low-volume)
- Keep sourcetypes tightly scoped:
- One sourcetype per format, not per app name.
- Reuse sourcetypes across services that log the same schema.
Don’t:
- Put everything in
index=main. That’s a dumpster fire. - Use sourcetypes like
app1_log,app2_logwhen they share the same format.
6.3 Search Performance
Do:
- Always filter early by
index,sourcetype,host, and time range. - Prefer indexed fields (like
host,source,sourcetype, custom indexed fields) in your first search clause. - Use
tstatsand accelerated data models when doing repeated analytics on the same datasets.
Don’t:
- Run
search *over “All time” in production. That’s how you become the villain in the Splunk admin’s story. - Overuse heavy regex field extractions on huge datasets at search time.
6.4 Data Model Acceleration Hygiene
Data model acceleration is powerful but not free:
Do:
- Accelerate only high-value, frequently used data models.(Splunk Lantern)
- Tune summary range to balance performance vs disk usage.(Splunk Documentation)
- Periodically disable unused accelerations to reclaim resources.
Don’t:
- Turn on acceleration for every model “just in case.” Disk and CPU will revolt.
- Ignore summarization job errors; when scheduled summarization exceeds time limits, summaries can lag behind.(Splunk Community)
6.5 Operational Practices
Do:
- Treat Splunk as critical infra:
- Monitoring for indexer & search head cluster health
- Backups / DR for config (apps, knowledge objects)
- Capacity planning for license, CPU, I/O
- Integrate with dev workflows:
- Standardize logging formats for services.
- Make dashboards part of “definition of done” for new systems.
Don’t:
- Let random teams create hundreds of ad-hoc saved searches and alerts with no governance.
- Give everyone
adminand hope for the best.
7. Conclusion & Key Takeaways
If you’re a data engineer, Splunk is:
- Your global log warehouse for infra, apps, and pipelines.
- A search and analytics engine for operational and security data.
- A platform where data modeling decisions (indexes, sourcetypes, data models) strongly impact cost and performance.
Key points to remember:
- Think in roles: forwarders (ingest), indexers (store/search), search heads (query/UI).
- Model your data: good index and sourcetype strategy = cheaper, faster Splunk.
- Use SPL seriously: it’s your investigation and analytics language.
- Scale intentionally: follow validated architectures, not random guesswork.
- Be ruthless with acceleration: enable it where it pays off; prune it where it doesn’t.
If you treat Splunk like a structured, governable data platform—not just “this log thing the SREs own”—you’ll unlock a ton of value for reliability, security, and analytics.
Internal Link Ideas (for a blog/ecosystem)
You could internally link this article to:
- “SPL 101: A Data Engineer’s Guide to Splunk Search Language”
- “Designing Logging Standards for Microservices (with Splunk Examples)”
- “Data Model Acceleration vs Raw Searches: When to Use Which”
- “Centralized Logging Patterns with Kafka, Kinesis, and Splunk”
- “Comparing Splunk with Elasticsearch / OpenSearch for Log Analytics”
Image Prompt (for DALL·E / Midjourney)
“A clean, modern data architecture diagram showing Splunk components — forwarders, indexers, and search heads — connected in a distributed cluster, with log streams flowing in and dashboards on top, minimalistic, high contrast, 3D isometric style.”
Tags
Splunk, LogAnalytics, Observability, DataEngineering, SPL, Monitoring, Indexing, Architecture, DevOps, SIEM


