If you’ve ever stared at a “pipeline failed” alert at 2 a.m. with no clue whether the problem is your API, database, queue, or Kubernetes node – New Relic is exactly the kind of tool that keeps you out of that hole.
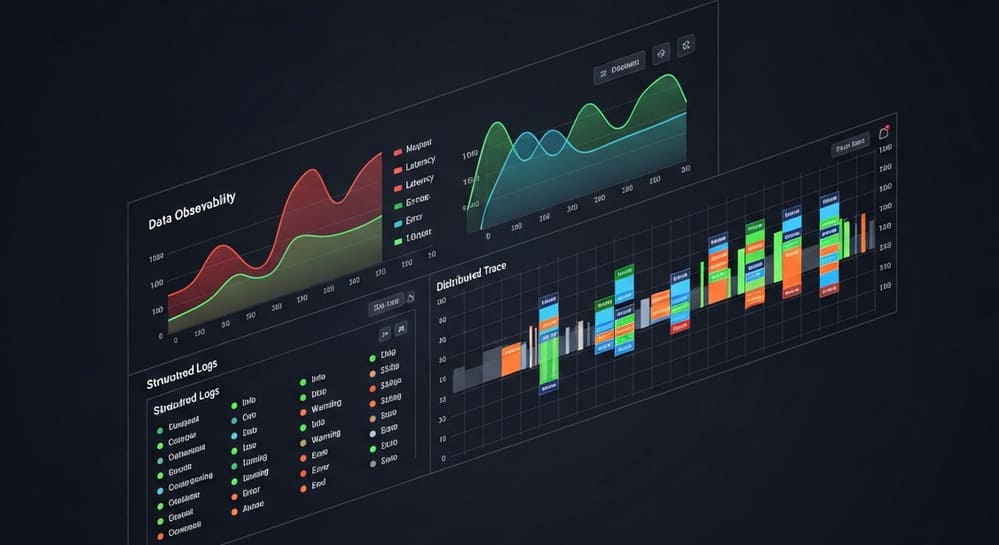
This isn’t “yet another dashboard.” It’s a full observability platform that can ingest metrics, events, logs, and traces (MELT) and give you one place to understand how your systems behave in the real world. (New Relic)
Below is a data-engineer-friendly walkthrough of New Relic: what it is, how it’s built, and how to actually use it to monitor data platforms, pipelines, and APIs.
What is New Relic, really?
Short definition:
New Relic is a cloud-based observability platform that unifies APM, infrastructure monitoring, logs, traces, browser/mobile monitoring, and alerting into one product. (wixmediagroup)
It’s often sold as “APM,” but that’s underselling it. Think of it as:
A telemetry warehouse + analytics engine + alerting brain
for everything your software and data stack does.
Key ideas:
- MELT telemetry
- Metrics: CPU, latency, queue depth, custom KPIs.
- Events: deploys, errors, job runs, business events.
- Logs: raw app and infra logs, searchable and correlated.
- Traces: end-to-end paths of a single request across services. (New Relic)
- Full-stack coverage
- Application Performance Monitoring (APM)
- Infrastructure & Kubernetes monitoring
- Browser & mobile RUM
- Logs, synthetic checks, serverless, AIOps, etc. (Nextlink 博弘雲端科技)
- One UI, one data backend (NRDB)
All telemetry is stored in New Relic Database (NRDB), queried via NRQL (New Relic Query Language). (New Relic)
For a data engineer, this means: you can treat your observability data as another analytics dataset – with schema, queries, and dashboards.
How New Relic is structured (mental model for data folks)
Imagine a pipeline just like you’d build in a data platform:
- Ingest (Agents & Integrations)
- Language agents (Python, Java, Node, .NET, etc.)
- Infra agent (hosts, containers, Kubernetes, cloud services)
- OpenTelemetry exporters and custom APIs (New Relic)
- Telemetry transport
- Data is sent via secure HTTPS/OTLP to New Relic.
- New Relic Database (NRDB)
- Optimized for high-cardinality time-series and event data.
- Stores metrics, logs, traces, events in a unified model. (New Relic)
- Analytics & UI layers
- Dashboards, charts, service maps.
- Querying via NRQL.
- Alert policies and AIOps (noise reduction, anomaly detection). (New Relic)
- Experience layer
- APM screens, infra views, Kubernetes cluster views.
- “Logs in context”: logs correlated with traces and errors. (New Relic)
Simple data-flow diagram (textual)
Your services & infra → Agents / OTel → New Relic ingest → NRDB
→ Dashboards, traces, logs, alerts → Engineers & on-call
If you understand a modern data lake + BI stack, you already understand 80% of New Relic.
Core New Relic capabilities (through a data / platform lens)
1. Application Performance Monitoring (APM)
APM gives you service-level telemetry for APIs, ETL microservices, and backend apps:
- Response time (p95, p99)
- Throughput (requests/minute)
- Error rate
- Apdex score (user satisfaction index)
- Transaction traces (slow calls, DB queries, external services) (DEV Community)
For example, you can quickly see:
- “This pipeline API slowed down after the last deploy.”
- “90% of time on this endpoint is spent in DynamoDB.”
- “Our Kafka consumer is blocking on an external API call.”
2. Infrastructure & Kubernetes Monitoring
New Relic’s infra layer gives you host, container, and cloud service metrics in context:
- CPU, memory, disk, network per host/container
- Node and pod health in Kubernetes
- Cloud services (EKS, EC2, Lambda, RDS, DynamoDB, etc.) (Amazon Web Services, Inc.)
This is where you answer:
- “Is this job slow because of code, or is the node swapping?”
- “Did we scale down the cluster too aggressively?”
- “Is our MongoDB or Cassandra cluster saturated?”
3. Logs in Context
Instead of flipping between your log tool and APM, New Relic can attach logs to traces and errors:
- APM agents can decorate logs (span.id, trace.id, entity metadata). (New Relic)
- From a slow transaction, you drill into exact logs for that request.
- From a noisy error, you jump into the app log lines that caused it.
This slashes mean time to resolution because you stop doing the “copy request ID → grep logs” dance.
4. Alerting & AIOps
New Relic lets you build alerts on:
- Metrics (latency, CPU, queue lag)
- NRQL queries (custom KPIs, SLOs)
- Events (deploys, job failures)
On top of that, AIOps helps de-duplicate, correlate, and detect anomalies so you don’t drown in Slack/Email noise. (Amazon Web Services, Inc.)
Real-world example: Monitoring a data pipeline with New Relic
Let’s say you have:
- A REST ingest API (Python/FastAPI)
- A Kafka topic
- A Flink/Spark job
- A NoSQL store (e.g., DynamoDB or MongoDB)
- A warehouse (Snowflake, BigQuery, etc.)
You want to know fast when:
- The ingest API is slow or erroring.
- Kafka lag grows.
- Your processing job is behind.
- Writes to NoSQL or the warehouse fail or slow down.
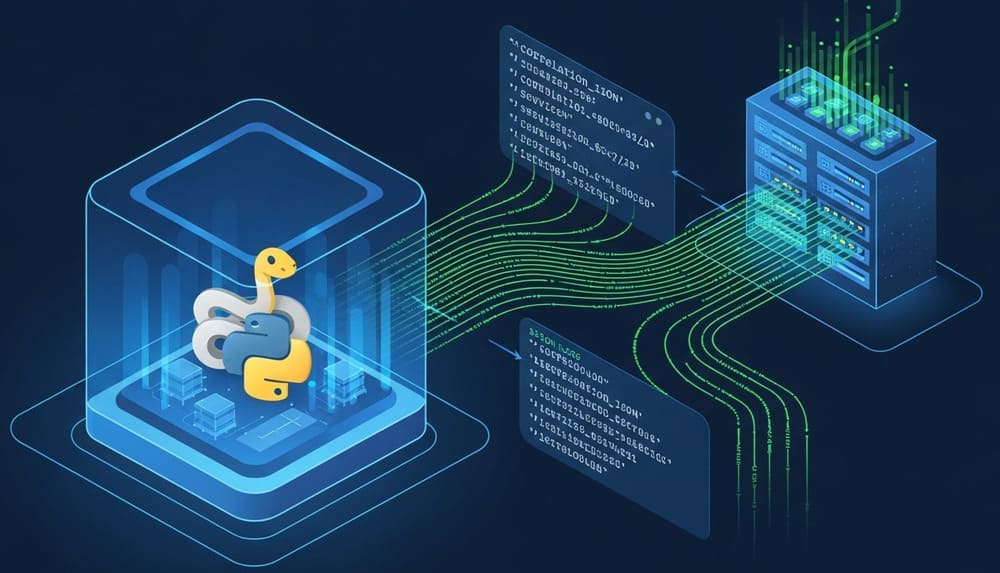
Step 1: Instrument your Python service with OpenTelemetry → New Relic
New Relic supports direct agents, but using OpenTelemetry keeps you portable. (New Relic)
# requirements:
# opentelemetry-sdk
# opentelemetry-exporter-otlp

import time
from fastapi import FastAPI
from opentelemetry import trace
from opentelemetry.sdk.resources import Resource
from opentelemetry.sdk.trace import TracerProvider
from opentelemetry.exporter.otlp.proto.http.trace_exporter import OTLPSpanExporter
from opentelemetry.sdk.trace.export import BatchSpanProcessor

# Configure OTel → New Relic
resource = Resource.create({
    "service.name": "ingest-api",
    "service.environment": "prod",
    "team": "data-platform",
})

provider = TracerProvider(resource=resource)
exporter = OTLPSpanExporter(
    endpoint="https://otlp.nr-data.net:4318/v1/traces",  # New Relic OTLP endpoint
    headers={
        "api-key": "<NEW_RELIC_LICENSE_KEY>",
    },
)
provider.add_span_processor(BatchSpanProcessor(exporter))
trace.set_tracer_provider(provider)

tracer = trace.get_tracer(__name__)
app = FastAPI()

@app.get("/ingest")
def ingest():
    with tracer.start_as_current_span("ingest-request") as span:
        # business logic...
        time.sleep(0.05)  # simulate work
        span.set_attribute("pipeline.step", "ingest")
        return {"status": "ok"}
Now New Relic can show:
- Latency and errors per endpoint.
- Traces across services (if everything uses OTel).
Step 2: Add custom metrics for pipeline health
You might want a metric like “records_processed_per_minute” or “kafka_lag.”
You can send custom metrics via New Relic APIs / OTel metrics exporter, then query them in NRQL:
-- Example NRQL: records processed per minute for last 30 minutes
SELECT sum(records_processed)
FROM Metric
WHERE metricName = 'pipeline.records_processed'
  AND service.name = 'flink-job'
SINCE 30 minutes ago
FACET pipeline_step
TIMESERIES 1 minute
Now your dashboard shows throughput trends and you can alert on drops.
Step 3: Correlate with logs in context
Configure your logging to include trace IDs; New Relic agents can automatically decorate logs and forward them, so from a single trace you can jump into the exact log lines for that run. (New Relic)
This is gold when debugging:
- “Why did this particular Kafka message fail?”
- “What was the payload when we got a 500 from DynamoDB?”
Comparison: New Relic vs “just CloudWatch / basic logs”
| Aspect | Basic logs / Cloud provider only | New Relic full observability |
|---|---|---|
| Signal types | Mostly logs + some infra metrics | Metrics, events, logs, traces (MELT) unified |
| Correlation | Manual (grep, copy/paste IDs) | Automatic logs-in-context, traces, service maps |
| Query language | Provider-specific, clunky for cross-stack | NRQL across all telemetry in one place |
| UX | Multiple consoles / tools | Single UI across app, infra, browser, mobile |
| Alerting | Metric-based, limited correlation | Metrics + NRQL + AIOps + anomaly detection |
| Vendor lock-in | Stuck per cloud | Can span multi-cloud, on-prem, and SaaS |
Best practices for using New Relic (especially for data & platform teams)
1. Start with “golden signals” per service
For each service/pipeline component, define:
- Latency (p95, p99)
- Traffic (requests/sec, rows/min)
- Errors (error rate, failure count)
- Saturation (CPU, memory, queue depth)
Build APM dashboards and alerts around these before you get fancy.
2. Tag everything properly
Consistent attributes/tags are non-negotiable:
service.nameservice.environment(dev, stage, prod)team,domainpipeline.step(ingest, transform, load, etc.)
Good tagging turns New Relic into a self-service analytics layer for your platform.
3. Design alerts like SLOs, not like log spam
- Alert on user-impacting symptoms, not low-level noise.
- “p95 latency > 1s for 5 minutes”
- “records_processed drops by 50%”
- Aggregate alerts at service level, not per host.
- Use multi-condition policies (e.g., high latency and elevated error rate).
Otherwise, you’ll burn out on alert fatigue and people will ignore New Relic.
4. Watch ingest volume and cardinality
- Don’t blast every debug log into New Relic in prod.
- Avoid extremely high-cardinality attributes (e.g., raw user IDs) on metrics.
- Use sampling and proper log levels (INFO/WARN/ERROR) to control cost and noise.
Observability can become your most expensive “data product” if you’re careless.
5. Treat observability as a product
- Version dashboards and alert configurations.
- Document what each panel means and which SLO it supports.
- Give each team a small, opinionated dashboard set, not 30 random charts.
New Relic is powerful, but without ownership it becomes a messy wall of graphs.
Common pitfalls (and how to avoid them)
- “We installed the agent, we’re done.”
- No, that’s baseline. You still need SLOs, alerts, and tagging.
- Ignoring infrastructure and focusing only on APM.
- You’ll miss node-level issues, noisy neighbors, and cluster exhaustion.
- Using it only as a log search tool.
- The whole point is tying metrics, logs, and traces together.
- No governance for custom metrics.
- You’ll end up with
myMetric,my_metric,my-metric– all meaning “records processed.”
- You’ll end up with
- Not integrating with deploy/change tracking.
- Always correlate deploy events with error spikes and latency changes.
Conclusion & key takeaways
New Relic is more than “a monitoring tool.” For a data or platform engineer, it’s:
- A unified telemetry platform for metrics, events, logs, and traces.
- A queryable data store (NRDB + NRQL) for your observability data.
- A diagnostics cockpit where you can trace issues across microservices, infra, and data pipelines.
If you design your tagging, golden signals, and alerts well, New Relic becomes:
The one place you check first when anything feels off in your data platform.
Treat it as a real product in your stack, not an afterthought bolt-on.
Image prompt (for DALL·E / Midjourney)
“A clean, modern observability dashboard showing a distributed microservices and data pipeline architecture monitored by New Relic, with charts for latency, error rates, infrastructure health, and logs in context; minimalistic, high-contrast, dark theme, 3D isometric style.”
Tags
NewRelic, Observability, Monitoring, DataEngineering, APM, Logs, Traces, SRE, DevOps, CloudMonitoring


