Grafana Loki: A Practical Guide to Log Aggregation for Data & Platform Engineers
If your “logging strategy” is still grep on random servers or a bloated ELK cluster that keeps running out of disk, Loki is aimed directly at you. It gives you centralized logs, cheap-ish storage, and tight Grafana integration — without indexing every single character of every log line.
For data and platform engineers, Loki is an important piece in the observability/data puzzle: it’s where unstructured, high-volume events live before they become metrics, alerts, or derived datasets.
What is Grafana Loki (and why should you care)?
Grafana Loki is a horizontally scalable, multi-tenant log aggregation system, designed to be cost-efficient and simple to operate. It was inspired by Prometheus: instead of indexing full text, Loki indexes labels (metadata) and stores log lines as compressed chunks in object storage. (Grafana Labs)
In practice, that means:
- You pay far less for storage than traditional “full-text indexed” systems like Elasticsearch.
- You query logs using LogQL, which feels very similar to PromQL if you already work with Prometheus. (Grafana Labs)
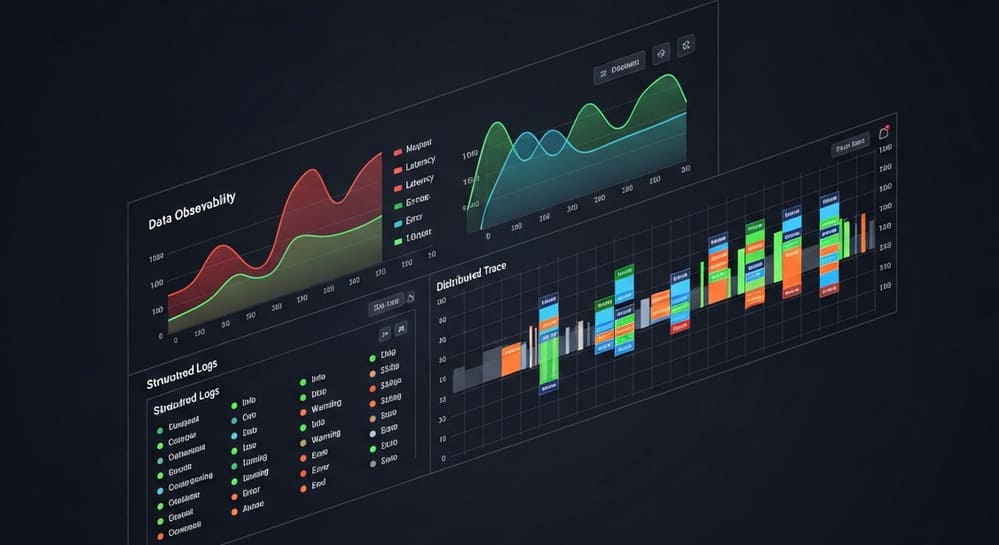
- You can correlate metrics and logs in a single Grafana dashboard (e.g., click a spike in latency → jump straight to the relevant logs). (TurboGeek)
If you’re building or operating data platforms, Loki is attractive whenever you have:
- Kubernetes or containerized workloads.
- High log volume with relatively repeatable metadata (cluster, namespace, app, environment).
- An existing Grafana + Prometheus setup.
Loki’s Architecture: How It Actually Works
At a high level, Loki has several core components that you can scale independently: (Grafana Labs)
- Agents / Shippers – Promtail, Alloy, Fluentd, Fluent Bit, etc. collect logs and push them to Loki.
- Distributor – Front door for writes. Receives log streams, validates them, and forwards to ingesters.
- Ingester – Buffers logs in memory, batches them into chunks, and writes them to long-term storage.
- Chunk Store – Object storage (S3, GCS, etc.) holding compressed log chunks.
- Index Store (TSDB / boltdb-shipper) – Stores a minimal index mapping label sets → chunks. (Grafana Labs)
- Query Frontend / Querier – Parses LogQL, fans out queries, fetches chunks from storage, filters lines.
- Ruler – Runs alerting and recording rules based on LogQL queries. (DevOpsCube)
Write Path (simplified)
- Agent parses logs and attaches labels (e.g.
cluster="prod",app="payments-api",env="prod"). - Distributor receives streams and hashes on labels to pick ingesters.
- Ingester groups logs into time-bounded chunks per label set, compresses them, and ships them to object storage.
- Loki writes a compact index entry pointing from labels + time range → chunk location.
Read Path (simplified)
- You send a LogQL query from Grafana.
- Query frontend parses the label selectors (e.g.
{app="payments-api", env="prod"}) and hits the index. - Loki finds relevant chunks for those streams.
- Querier pulls the chunks, decompresses them, and runs text filters/regex on the actual log lines. (Grafana Labs)
Key idea: Loki only indexes labels, not the full log text. That’s the whole cost/performance trick.
Loki vs ELK and Prometheus: Where It Fits
Instead of replacing everything, Loki typically sits alongside metrics and traces:
| Tool | Primary Data | Indexing Model | Typical Use Case |
|---|---|---|---|
| Prometheus | Metrics | Time-series, label index | SLIs, SLOs, alerts, dashboards |
| Loki | Logs | Labels only, chunk storage | Debugging, correlation with metrics |
| ELK (ES) | Logs | Full-text inverted index | Search-heavy, ad-hoc forensic analysis |
Loki wins when:
- You already live in Grafana/Prometheus world.
- You care about cost and scalability more than ultra-fancy full-text search.
- Your query patterns are “by label first, then filter text”.
If your requirements look like: “Legal team wants arbitrary text search over 180 days of application logs,” Loki alone will probably frustrate them. You’d either:
- Design labels carefully and possibly add a search-specialized system, or
- Use ELK/OpenSearch for that particular compliance use case.
Core Concepts for Data & Platform Engineers
1. Labels and Log Streams
In Loki, logs are grouped into streams, where each stream is defined by a set of labels. Labels are just key-value pairs: (Grafana Labs)
{cluster="prod", namespace="payments", app="payments-api", env="prod"}
- All logs with exactly this set of labels form one stream.
- Good labels: region, cluster, namespace, app, environment, service.
- Bad labels: request ID, user ID, session ID, anything highly dynamic.
High label cardinality (too many unique label values) kills Loki performance and inflates cost — just like high-card metrics in Prometheus. (Grafana Labs)
2. Chunks & Storage
Loki stores logs as compressed chunks in long-term storage (S3, GCS, etc.). The index maps:
(label set, time range) → one or more chunks.
Modern Loki uses a TSDB-based index (recommended over older boltdb-shipper) for better query performance and simpler single-store setups. (Grafana Labs)
Implication for you:
- Object storage = cheap, near-infinite retention.
- Index stays relatively small because it tracks streams + time, not every log token.
3. LogQL: Querying Loki
LogQL has two major layers:
- Log stream selector – label filters
- Filter and pipeline stage – text/regex filtering, parsing, metrics aggregation
Example: find error logs for payments-api in prod:
{app="payments-api", env="prod"} |= "ERROR"
Count error rate over time:
sum by (app) (
  rate({app="payments-api", env="prod"} |= "ERROR" [5m])
)
Parse JSON logs and filter:
{app="payments-api", env="prod"}
| json
| level = "error"
|= "payment_failed"
If you already know PromQL, LogQL will feel familiar very quickly. (Grafana Labs)
A Simple Loki Stack: Example Setup (K8s / Docker)
A very typical setup today:
- Prometheus – metrics
- Loki – logs
- Grafana – visualization
- Promtail or Alloy – log shipping from nodes/containers
Using Docker Compose or a home-lab stack, you can wire them together and build one dashboard for both metrics & logs. (TurboGeek)
Example: a minimal promtail config scraping container logs:
server:
  http_listen_port: 9080
  grpc_listen_port: 0

positions:
  filename: /tmp/positions.yaml

clients:
  - url: http://loki:3100/loki/api/v1/push

scrape_configs:
  - job_name: containers
    static_configs:
      - targets:
          - localhost
        labels:
          job: containers
          __path__: /var/log/containers/*.log
You attach meaningful labels at this stage (cluster, app, env). That design work is where data/platform engineers actually add value.
Best Practices for Running Loki in Production
Let’s be blunt: Loki is powerful, but you can absolutely wreck it with bad label design and unbounded cardinality.
Here are the non-negotiables:
1. Treat Label Design as a Schema
- Use static, bounded labels: environment, region, cluster, namespace, app, team. (Grafana Labs)
- Avoid putting high-cardinality stuff in labels (user IDs, request IDs, IPs).
- For high-cardinality fields you still want to search sometimes, keep them in the log body (JSON) and parse in LogQL.
2. Watch Label Cardinality Like a Hawk
- Monitor stream counts, label cardinality, and index size.
- High cardinality = many small streams = tons of tiny chunks = painful queries. (Grafana Labs)
If your stream count explodes, you messed up label design. Fix that before throwing more hardware at it.
3. Optimize Chunk & Retention Settings
- Tune chunk size / flush durations so you don’t create millions of tiny chunks. Fewer, larger chunks generally lead to better query performance. (Titan Eric)
- Use appropriate retention by environment:
- prod: 7–30 days in hot storage, longer in cheaper tiers or archived.
- non-prod: much shorter retention.
4. Use TSDB Index for New Deployments
- For Loki ≥ 2.8, TSDB is the recommended index backend, giving better performance and TCO than legacy boltdb-shipper. (Grafana Labs)
Don’t start a new deployment on deprecated storage modes unless you enjoy migrations.
5. Integrate with Metrics & Alerts
- Build correlated Grafana dashboards: metrics panel on top, logs panel below for the same label set. (Grafana Labs)
- Use Loki ruler to create alerts when error logs spike or specific patterns appear. (HackerNoon)
This is where Loki stops being “a log trash can” and becomes part of your operational nervous system.
Common Pitfalls (and How to Avoid Them)
Here’s where teams usually screw up:
- Label explosion
- Symptom: queries get slow, CPU and RAM explode, index balloons.
- Cause: labels from request IDs, dynamic paths, user IDs, or pod names with random suffix baked into labels.
- Fix: move those into the log body; keep labels stable and bounded.
- Abusing Loki as a search engine
- Symptom: everyone tries arbitrary full-text search over months of data.
- Reality: Loki is optimized for structured, label-driven queries, not forensic full-text search.
- Fix: educate teams; design logs and labels around real query patterns.
- Zero governance on retention and cost
- Symptom: S3 bill suddenly looks like a security incident.
- Fix: apply environment-based retention, drop noisy logs, keep only what actually drives debugging and SLOs.
- No dashboards, only raw log views
- Symptom: engineers scroll logs like it’s 2009.
- Fix: build dashboards combining Prometheus metrics and Loki logs; teach people LogQL & PromQL basics.
How Loki Fits the Data Engineer’s World
Why should a data engineer care about Loki, not just SREs?
- Loki is often the raw event firehose before events are transformed into metrics, alerts, or ingested into data lakes.
- You can:
- Use Loki logs as a troubleshooting surface for streaming jobs (Flink, Spark Streaming, Kafka consumers).
- Correlate pipeline failures with infrastructure logs (Kubernetes, Airflow, db logs).
- Establish patterns of structured logging that make downstream data ingestion saner.
Think of Loki as:
“The structured, label-driven log lake that complements your data lake/warehouse.”
If you design labels and log formats intelligently, you’ve already done half the modeling work for later analytical pipelines.
Conclusion & Takeaways
Loki is not magic, and it’s not a free ELK replacement. But if you:
- Already live in the Prometheus + Grafana world,
- Want log aggregation that actually scales without eating your budget,
- Are willing to be disciplined about labels and retention,
…then Loki is a very strong default choice.
Key points to remember:
- Loki indexes labels, not log text → cheaper, scalable, but demands good label design.
- Use TSDB index + object storage for modern deployments.
- Keep labels low-cardinality and stable; move dynamic fields into the log body.
- Integrate Loki with Prometheus and Grafana for full observability.
- Treat Loki as a first-class data source in your platform, not a dumping ground.
If you’re serious about observability, Loki should be part of your toolbox — but it only shines if you’re willing to design it, not just install it.
More to read:
- “Prometheus for Data Engineers: From Metrics to SLOs”
- “Structured Logging 101 for Python & Kubernetes”
- “Choosing Between Loki, ELK, and OpenSearch for Production Logs”
- “Designing Labels and Tags for Observability (Prometheus + Loki)”
- “Building a Unified Observability Stack with Grafana, Prometheus, Loki, and Tempo”
Image Prompt (for DALL·E / Midjourney)
“A clean, modern observability architecture diagram showing Grafana Loki in the center, connected to log shippers (Promtail/Alloy), Kubernetes clusters, object storage, and Grafana dashboards — minimalistic, high contrast, 3D isometric style, dark background, neon accent lines.”
Tags
#Loki #Grafana #Logging #Observability #Prometheus #Kubernetes #DevOps #SRE #LogQL #CloudNative


