Graylog for Monitoring: The Practical Guide for Data & Platform Engineers
If you’ve ever SSH’d into three different boxes at 3 a.m. and run grep ERROR like your life depended on it… Graylog is basically the tool that lets you never do that again.
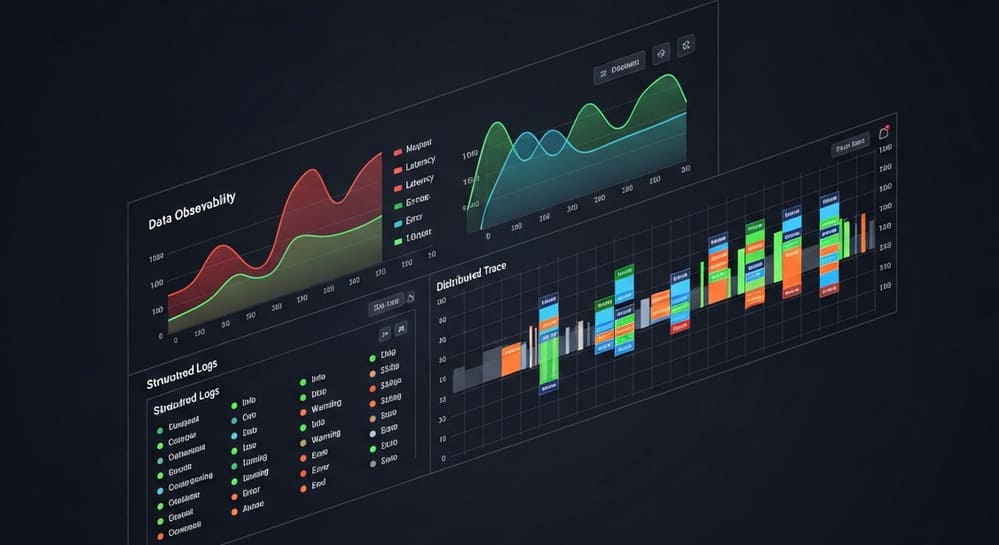
It turns scattered application and infrastructure logs into one searchable, alertable source of truth — especially useful when you’re running distributed data pipelines, microservices, or a zoo of cloud services.
What Is Graylog (and Why Should You Care)?
Graylog is an open-core log management and security analytics platform. It ingests logs from servers, containers, apps, and network devices; stores them in a scalable backend (OpenSearch/Elasticsearch); and gives you fast search, dashboards, and alerts. (Lydtech Consulting)
From a data/DevOps engineer perspective, Graylog gives you:
- Centralized logging for all your apps, jobs, and pipelines
- Fast search & filters over millions of events
- Dashboards for health of ETL jobs, APIs, Kafka, databases
- Alerting on error rates, anomalies, or missing events
- Security/Compliance use cases (audit logs, access logs, etc.)
It’s built around a stack:
- Graylog Server / Web UI – API + UI + processing engine
- Data Node + OpenSearch/Elasticsearch – log storage & indexing (Lydtech Consulting)
- MongoDB – configuration & metadata (streams, dashboards, users, pipelines) (Graylog Community)
Graylog Architecture in Plain English
Think of Graylog as a logistics hub:
- Shippers (Sidecar, Beats, syslog, app loggers) = trucks bringing parcels
- Graylog Server = sorting center
- Data Node + OpenSearch/Elasticsearch = warehouse of all parcels
- MongoDB = where you store the warehouse’s blueprint & rules
- Dashboards & Alerts = screens and sirens watching what’s happening
Core Components
| Component | Role in the Stack |
|---|---|
| Graylog Server | Receives logs, parses/enriches, routes, exposes UI & API |
| Inputs | “Ports” where logs arrive (Syslog, GELF, Beats, HTTP, etc.) |
| Extractors | Regex/grok/JSON parsers that turn raw text into fields |
| Pipelines | Rule engine for enrichment, routing, dropping noise |
| Streams | Virtual subsets of logs (e.g. service:payments, env:prod) |
| Data Node (OpenSearch/ES) | Stores indexed log messages for search/analytics |
| MongoDB | Stores configuration, users, dashboards, alerts, pipelines |
| Sidecar / Forwarder | Agents that ship logs from servers/containers (Graylog Docs) |
Log Lifecycle in Graylog
Graylog’s docs define a clear “log lifecycle”: (Graylog Docs)
- Ingestion – logs arrive through Inputs (syslog, GELF, Beats, HTTP).
- Normalization & Parsing – extractors & pipelines turn messy text into structured fields.
- Storage – messages written to Data Nodes (OpenSearch/Elasticsearch indices).
- Analysis & Visualization – queries, dashboards, correlations, alerts.
Visually:
[App / Server / Cloud Service]
          │  (Syslog / GELF / Beats / HTTP)
          ▼
     Graylog Input
          ▼
 [Extractors & Pipelines]
          ▼
   Data Node (OpenSearch)
          │
          ├─ Dashboards / Saved Searches
          └─ Events & Alerts (Slack, Email, PagerDuty, etc.)
Example: Monitoring a Data Pipeline with Graylog
Imagine you’re running nightly Spark jobs + streaming ingestion, and business complains: “Our dashboards are stale again.” You need visibility into:
- Job start/end times
- Error stacks
- Lag in message processing
- API timeouts to Snowflake / S3 / Kafka
Step 1: Send Structured Logs (GELF)
Graylog loves GELF (Graylog Extended Log Format). (GitHub)
Your app can emit JSON-like messages over UDP/TCP/HTTP:
{
  "version": "1.1",
  "host": "spark-job-runner-01",
  "short_message": "ETL job completed",
  "full_message": "Job etl_orders_daily finished successfully.",
  "timestamp": 1732588800,
  "level": 6,
  "_job_name": "etl_orders_daily",
  "_env": "prod",
  "_duration_ms": 84231,
  "_records_processed": 1578923
}
Key idea: everything that starts with _ becomes a searchable field (job_name, env, duration_ms, etc.).
Step 2: Create a Stream for the Job
In Graylog, define a Stream that captures all messages with _job_name: etl_orders_daily.
Now you can:
- Query failures:
job_name:etl_orders_daily AND level:3 - View a dashboard for:
- Job runtime over time
- Processed record counts
- Error rate
Step 3: Add Alerts
Configure an Event Definition:
- Condition:
- No successful job run in last 24h OR
count(level:3 OR level:4) > 0in last hour forjob_name:etl_orders_daily.
- Notification:
- Slack channel
#data-incidents - Email to on-call / data platform DL
- Slack channel
When the pipeline breaks, Graylog creates an Event and fires the notification. (Graylog Docs)
Querying Logs Like a Pro
Graylog’s query language feels similar to Lucene / Elastic: (Lydtech Consulting)
Some useful patterns:
# All 5xx errors in prod in the last 15 minutes
env:prod AND http_status:[500 TO 599]

# Slow queries for a specific service
service:orders-api AND duration_ms:>1000

# Kafka consumer lag warnings
component:kafka-consumer AND level:WARN AND message:"lag"
Save these as Searches and pin charts to dashboards.
Pipelines: Your Log Transformation Layer
Graylog pipelines are rule-based processors that let you enrich, route, or drop messages before indexing. (Graylog Docs)
Example: tag slow ETL runs as severity:high:
rule "mark_slow_etl"
when
  has_field("job_name") &&
  to_string($message.job_name) == "etl_orders_daily" &&
  has_field("duration_ms") &&
  to_long($message.duration_ms) > 600000   // > 10 minutes
then
  set_field("severity", "high");
  route_to_stream("slow-etl-stream");
end
This lets you:
- Drive alerts off severity instead of raw metrics
- Route slow jobs to a separate stream for focused dashboards
- Keep noisy-but-important events labeled for later analysis
Best Practices for Using Graylog as a Monitoring Tool
1. Design Your Log Schema Intentionally
Don’t ship random strings. Decide on:
- Common fields:
service,env,host,job_name,request_id,user_id - Numeric fields: durations, sizes, counts (
duration_ms,payload_bytes) - Context fields:
cluster,region,source_system
This pays off in query simplicity and performance.
2. Use Structured Logs Everywhere You Can
Plain text logs mean painful regex extractors and brittle parsing.
Prefer:
- JSON/GELF from apps
- Log appenders for common stacks (Java, .NET, Node, Python loggers often have GELF or JSON appenders) (GitHub)
You can still ingest legacy syslog, but make new services structured.
3. Plan Storage and Retention Upfront
Graylog relies on OpenSearch/Elasticsearch for indices; storage explodes fast. (Lydtech Consulting)
- Use index sets with:
- Reasonable index size (e.g. 20–50 GB)
- Roll-over policies based on time or size
- Different retention for prod vs. non-prod
- Offload raw logs to cheap storage (S3/object storage) if needed and retain only the useful window in Graylog.
4. Separate High-Volume and High-Value Logs
Not all logs are equal:
- High-value: security events, job failures, payment flows
- High-volume: debug logs, trace-level noise, some access logs
Use separate streams & index sets so high-value queries don’t fight with garbage.
5. Scale with a Multi-Node Setup
For serious volume, move to a multi-node Graylog cluster: (Graylog Docs)
- Multiple Graylog server nodes behind a load balancer
- Multiple Data Nodes / OpenSearch nodes
- MongoDB replica set for HA
- Sidecar/Forwarder agents on each host
This gives:
- Horizontal scaling for ingestion & search
- No single point of failure for the monitoring stack itself
6. Secure the Stack
Log systems contain sensitive data (tokens, PII, IP addresses).
From Graylog’s own guidance: secure transport, access control, and data retention are mandatory. (Graylog Docs)
- TLS on all external endpoints
- Role-based access: separate views for SRE, security, dev teams
- Mask or drop sensitive fields in pipelines
- Rotate credentials & API tokens regularly
Common Pitfalls to Avoid
- “Just log everything” mentality
- You’ll blow up your storage and make queries slow.
- Be intentional: log what you will actually use.
- No correlation IDs
- Without
request_id/trace_id, debugging distributed workflows is hell. - Propagate them through each service and into logs.
- Without
- Dashboards nobody looks at
- A dashboard that isn’t tied to decisions or alerts is decoration.
- Make dashboards that support specific questions:
- “Is our nightly ETL on time?”
- “Is API latency within SLO?”
- Alert fatigue
- Too many noisy alerts → people ignore them.
- Alert on symptoms that matter: failure rates, SLO breaches, missing events.
- Treating Graylog as a data warehouse
- It’s optimized for operational log analytics, not arbitrary BI.
- Keep heavier analytical workloads in your warehouse/lake; use Graylog for time-bounded, operational questions.
Graylog vs Other Monitoring/Logging Tools (Quick View)
| Tool | Strengths | Trade-offs |
|---|---|---|
| Graylog | Open-core, strong pipelines/streams, good SIEM & log mgmt, OpenSearch-based | More ops work than SaaS; you run the stack |
| ELK/OS stack | Very flexible search/analytics, huge ecosystem | DIY UI & alerting; more to assemble |
| Splunk | Powerful, polished, lots of features | Expensive; licensing complexity |
| Datadog | Integrated metrics + traces + logs (SaaS) | Vendor lock-in, ongoing cost |
Graylog is a solid choice if:
- You want control over your own log/SIEM stack
- You’re comfortable managing Elasticsearch/OpenSearch + MongoDB
- You need both security and ops monitoring in one place
Conclusion & Takeaways
For a data/platform engineer, Graylog is:
- Your X-ray into distributed systems and data pipelines
- A way to centralize logs and make failures observable
- A rules engine (pipelines) to enrich, route, and normalize logs
- A monitoring and alerting hub for both reliability and security
If you’re already running Kafka/Spark/Snowflake or complex microservices, Graylog helps you answer:
- “What broke?”
- “Where did it break?”
- “How often does this happen?”
- “Who touched what, and when?”
The sooner you standardize structured logging and wire your services into Graylog, the faster your team can move without flying blind.
Ideas for Related Internal Links
You could internally link this article to:
- “Centralized Logging Patterns for Microservices”
- “Designing JSON Log Schemas for Data Pipelines”
- “OpenSearch vs Elasticsearch for Log Management”
- “Alerting Strategies for SLO-based Monitoring”
- “Security Logging Basics for Data Platforms”
Image Prompt (for DALL·E / Midjourney)
“A clean, modern observability architecture diagram showing Graylog at the center receiving logs from servers, containers, and cloud services, storing data in an OpenSearch cluster and MongoDB, with dashboards and alerts on top — minimalistic, high-contrast, 3D isometric style.”
Tags
Hashtag style:
#Graylog #Monitoring #Logging #Observability #OpenSearch #DevOps #DataEngineering #SIEM
Comma style:
Graylog, log monitoring, centralized logging, observability, OpenSearch, Elasticsearch, DevOps, data engineering, SIEM


