Dynatrace for Data & Platform Engineers: Turning Observability into Actual Insight
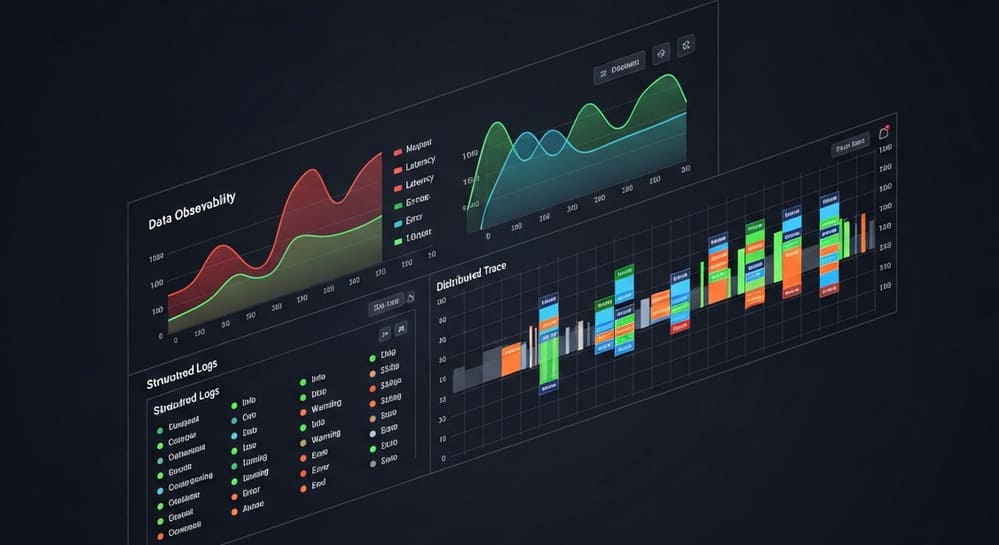
If your services are “green” in dashboards but users still complain, you don’t have observability — you have colorful lies. Dynatrace sits exactly in that gap: it doesn’t just collect metrics and logs, it tries to explain what’s going on across apps, infra, and services.
This article is a practical, data/engineering-focused overview of Dynatrace: what it is, how it works, how to use it well, and how not to shoot yourself in the foot with noisy alerts and dashboard theater.
What is Dynatrace (Really)?
High level: Dynatrace is an all-in-one observability and monitoring platform that covers:
- Application performance monitoring (APM)
- Infrastructure & cloud monitoring
- Real user monitoring (RUM) & synthetic checks
- Log management & analytics
- Security and vulnerability detection
- AI-powered root cause analysis (Davis AI)
Key idea: instead of you wiring everything manually (“this service talks to that DB, these pods belong to this app”), Dynatrace auto-discovers and maps your environment using agents and cloud integrations.
For data / platform engineers, that means:
- You see end-to-end traces from user request → API → DB → external services.
- You can align APM signals with infra and deployment events (e.g., “this release at 14:03 broke latency”).
- You get smart baselines and anomaly detection, instead of writing a thousand if-latency>300ms alerts.
Dynatrace Architecture: How It Hangs Together
Think of Dynatrace as three main layers:
- Data Collection Layer
- Smart Brain (Davis AI & topology)
- Experience Layer (dashboards, alerts, APIs)
1. Data Collection: OneAgent, Extensions, and Cloud Integrations
OneAgent is Dynatrace’s main workhorse.
- Installed on hosts (VMs, bare metal) or injected into containers/Kubernetes nodes.
- Auto-instruments supported technologies (Java, .NET, Node.js, Python, Go, web frontends).
- Collects:
- Metrics (CPU, memory, GC, response time, error rates)
- Traces (distributed tracing across services)
- Logs (if enabled / integrated)
- Process details (services, ports, frameworks)
Other data sources:
- Cloud integrations: AWS, Azure, GCP (CloudWatch, Azure Monitor, etc.)
- Synthetic monitoring: scripted tests that probe endpoints from various locations
- Log ingestion: via agents, log forwarders, or APIs
- Custom metrics/events: pushed from your code, CI/CD, or data pipelines
2. Smart Brain: Smartscape Topology + Davis AI
This is where Dynatrace differentiates itself.
- Smartscape automatically builds a real-time map:
- Hosts → Processes → Services → Applications
- Dependencies between them (who calls whom, which DBs are used, etc.)
- Davis AI sits on top of this topology and:
- Learns baselines (normal latency, throughput, error rates per service)
- Detects anomalies and correlated issues
- Tries to point to the root cause, not just symptoms
Instead of 50 separate alerts (“CPU high here, latency up there”), you get a unified problem:
“Service X latency increased due to DB Y response time degradation on host Z after deployment event.”
3. Experience Layer: Dashboards, Alerts, and APIs
Dynatrace provides:
- Prebuilt dashboards (APM, Kubernetes, Hosts, Services, RUM)
- Custom dashboards with:
- Timeseries charts
- Topology views
- Error / latency breakdowns
- Alerting integrated with:
- Slack / Teams
- PagerDuty / Opsgenie
- Email, webhooks, etc.
- An API for:
- Exporting metrics to other systems
- Automating configs (dashboards, alerts, SLOs)
- Integrating with CI/CD
Dynatrace for Data & Analytics Workloads
It’s not just for web services. For data engineers, useful scenarios include:
- Monitoring Spark / EMR / Databricks clusters via host/infra metrics and service traces
- Observing Kafka/Kinesis producers/consumers and lag
- Keeping an eye on database performance (PostgreSQL, MySQL, Oracle, etc.)
- Monitoring ETL/ELT jobs and APIs that feed your data platform
Typical questions Dynatrace can help you answer:
- “Why did this nightly ETL batch suddenly double in runtime?”
- “Why are our APIs timing out when writing to the data warehouse?”
- “Is this regression due to code, infra, or external dependency?”
Example: Instrumenting a Python Service with Dynatrace
For many modern setups, you’ll rely primarily on OneAgent on the host/Kubernetes node, which auto-detects your Python web framework (Flask, FastAPI, Django, etc.) and traces requests.
But you can also send custom metrics/events from your code via API.
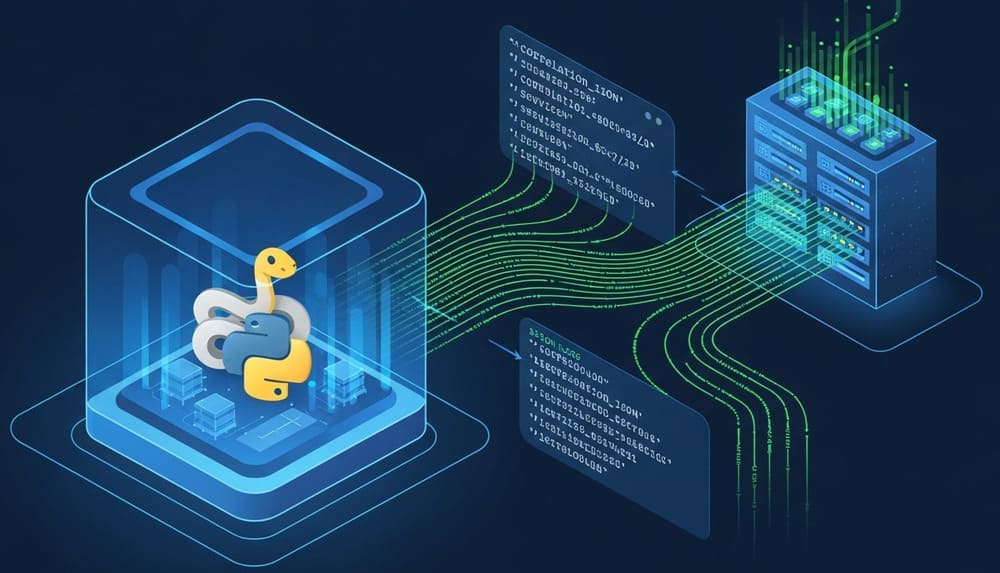
Here’s a pseudo-style example of pushing a custom metric (e.g., ETL job duration) via an HTTP POST to Dynatrace’s metrics ingest API:
import time
import requests

DYNATRACE_URL = "https://<your-env>.live.dynatrace.com/api/v2/metrics/ingest"
API_TOKEN = "<api_token_with_metrics_ingest_scope>"

def push_metric(metric_name: str, value: float, dims: dict | None = None) -> None:
    """
    Push a single custom metric to Dynatrace.
    Example metric line:
    my.etl.duration_ms,env=prod,job=orders_stage 12345
    """
    dims = dims or {}
    dim_str = ",".join(f"{k}={v}" for k, v in dims.items())
    dim_suffix = f",{dim_str}" if dim_str else ""
    line = f"{metric_name}{dim_suffix} {value}"

    resp = requests.post(
        DYNATRACE_URL,
        headers={"Authorization": f"Api-Token {API_TOKEN}"},
        data=line.encode("utf-8"),
        timeout=5,
    )
    resp.raise_for_status()

def run_job():
    start = time.perf_counter()
    # ... run ETL work here ...
    time.sleep(2)  # simulate work
    duration_ms = (time.perf_counter() - start) * 1000
    push_metric(
        "etl.job.duration_ms",
        duration_ms,
        {"env": "prod", "job": "orders_stage"}
    )

if __name__ == "__main__":
    run_job()
Once ingested, you can:
- Visualize this metric on a custom dashboard
- Set alerts like: “If
etl.job.duration_msfor job=orders_stage is 3x baseline, trigger an alert.”
This ties your data engineering world into the same observability fabric as your application and infra metrics.
Best Practices When Using Dynatrace
1. Treat It as Observability, Not Just Monitoring
Bad pattern: “We installed Dynatrace, now we’re done.”
Better approach:
- Define SLOs for key services and data products (availability, latency, freshness).
- Use Dynatrace to measure these SLOs, not just show CPU charts.
- Wire Dynatrace alerts to user-impacting metrics, not everything that moves.
2. Start with Auto-Discovery, Then Add Custom Metrics
- Let OneAgent discover services, dependencies, and baselines.
- Once stable, add custom metrics for:
- Data freshness (lag, last successful load timestamp)
- Pipeline health (success/fail counts)
- Key business KPIs (orders, signups, etc.)
This avoids overcomplicating your setup on day one.
3. Align Alerts with Ownership
Common mistake: “Everyone gets every alert.”
Instead:
- Map services and pipelines to teams.
- Route alerts based on ownership (app team, platform team, data team).
- Use tags (e.g.,
team=data-eng,env=prod) for routing and filtering.
4. Use Topology & Davis AI to Debug, Not Just Timeseries
When there’s an incident:
- Start from the Problem view (Davis analysis).
- Look at Smartscape to see what’s upstream/downstream from the failing component.
- Only then drill into individual metrics and logs.
You’ll get to root cause faster vs. staring at a single CPU graph and guessing.
5. Watch Cost & Noise
Dynatrace is powerful, but:
- Too many custom metrics/log ingestion can get expensive.
- Too many low-value alerts → alert fatigue → people ignore everything, including critical issues.
Guidelines:
- Only ingest metrics/logs that drive decisions or alerts.
- Regularly review and prune unused dashboards/alerts.
- Aggregate where possible (e.g., job-level metrics instead of per-row noise).
Common Pitfalls (and How to Avoid Them)
Pitfall 1: Treating it as a black box “magic AI”
- Davis AI helps, but you still need good service boundaries, meaningful names, and proper tagging.
- If everything is named “service-default,” the AI can’t save you.
Pitfall 2: Monitoring infra only, ignoring apps and user experience
- CPU and memory “look fine” while user latency is terrible.
- Always include:
- Real User Monitoring (RUM) or synthetic checks
- Application traces (APM)
- Infra metrics
Pitfall 3: No integration with CI/CD
- If Dynatrace doesn’t see deploy events, you lose a huge signal.
- Integrate with your pipelines so each deployment is visible as an event/timespan.
Pitfall 4: Dashboards built for demo, not for ops
- Lots of pretty graphs, but no:
- Clear SLO widgets
- Error budgets
- “Is the system healthy?” summary
Build dashboards with on-call needs in mind, not for stakeholder screenshots.
Where Dynatrace Fits vs Other Tools
~ Very high-level comparison (not exhaustive) ~
| Aspect | Dynatrace | Prometheus + Grafana | Datadog |
|---|---|---|---|
| Data collection | Agent-heavy, auto-instrumentation | Pull model via exporters | Agents + integrations |
| Topology mapping | Built-in Smartscape | Manual/labels + Service Map | Service Map |
| AI root cause | Davis AI included | Add-ons / manual | AIOps features |
| Use-case focus | Enterprise APM + full observability | Metrics-first | General SaaS observability |
| Learning curve | Medium (concept-heavy, opinionated) | Medium-High (more DIY) | Medium |
Dynatrace shines when:
- You want a strongly integrated, opinionated platform
- You’re okay with agents and auto-discovery
- You need enterprise-level features, governance, and AI-assisted analysis
Conclusion & Takeaways
Dynatrace is more than “yet another monitoring tool.” For data, platform, and application engineers it can become the central nervous system of your stack:
- It auto-discovers your services and infrastructure.
- It correlates metrics, logs, traces, and user behavior.
- It uses topology + AI to point at likely root causes instead of spamming you with raw symptoms.
If you use it well — with clear SLOs, smart tagging, and CI/CD integration — Dynatrace can reduce incident resolution time, expose hidden performance issues, and give your data pipelines the same level of visibility as your APIs.
If you use it badly — random dashboards, noisy alerts, zero ownership — it just becomes an expensive graph gallery.
Key Takeaways
- Start with OneAgent + auto-discovery, then add custom metrics for your critical data workloads.
- Define SLOs and ownership before you go wild with alerts.
- Use Davis AI + Smartscape during incidents, not just isolated charts.
- Keep observability cost and alert noise under control by pruning regularly.
- Integrate Dynatrace deeply with CI/CD and tagging strategy so context is always clear.
Image Prompt (for DALL·E / Midjourney)
“A clean, modern observability dashboard showing a distributed microservices and data pipeline architecture monitored by an AI assistant, with nodes, connections, and alerts highlighted — minimalistic, high-contrast, 3D isometric style, dark background, neon accents.”
Tags
Dynatrace, Observability, APM, Monitoring, DataEngineering, SRE, CloudNative, Microservices, DevOps, PlatformEngineering


