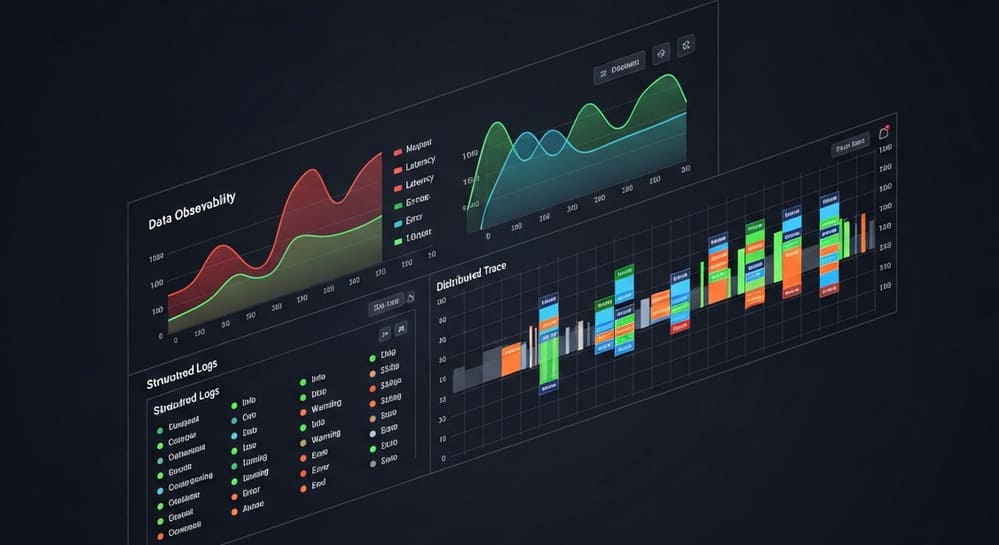
Datadog for Data Engineers: Turning Monitoring into Data Observability
When your nightly pipeline dies at 3:07 AM, “CPU high on some EC2” is useless.
You want one screen that tells you: which pipeline, where it broke, how much data is stuck, and who owns the fix. That’s exactly where Datadog moves from “DevOps tool” to “data engineer’s weapon.”
This article is about using Datadog as a data observability platform, not just infra monitoring.
1. What is Datadog (from a Data Engineer’s POV)?
Datadog is a monitoring and security platform for cloud-scale apps that ingests metrics, logs, traces, and alerts across infra, apps, and services.(Airbyte)
For data people, the important pieces are:
- Metrics – latency, throughput, error rates, costs
- Logs – transformation errors, schema issues, validation failures
- Traces / APM – how requests flow across microservices and jobs(Datadog Monitoring)
- Observability Pipelines – control and transform logs/metrics before they hit Datadog or your lake(Datadog)
- Data Streams Monitoring (DSM) – map and monitor streaming data pipelines (Kafka, RabbitMQ, etc.) with latency and lag metrics(Datadog Monitoring)
- Data Observability (Preview) – monitors data quality issues via metrics, metadata, lineage, and logs across your stack.(Datadog Monitoring)
Think of Datadog as the control tower for all your pipelines: batch, streaming, APIs, dbt, whatever.
2. Core Concepts: Metrics, Logs, Traces & Data Streams
Datadog is easiest to understand if you map it to data-engineering primitives.
2.1 The Three Classic Pillars
- Metrics
- Numbers over time.
- Examples: rows processed, job duration, Kafka lag, warehouse credits, error rate.
- Logs
- Text + structured context.
- Examples: “schema mismatch on column order_id”, “dead-lettered message”, “Snowflake query failed: lock timeout”.
- Traces (APM)
- End-to-end journeys of requests or events across services.(Datadog Monitoring)
- Example: “API → Kafka → stream processor → warehouse loader → BI refresh”.
2.2 Data Streams Monitoring (DSM)
Datadog Data Streams Monitoring gives you a topology map of your streaming pipelines: which services produce, which consume, and what the health metrics are.(Datadog Monitoring)
Key DSM metrics:
| Metric name | What it tells you | Why data engineers care |
|---|---|---|
data_streams.latency | End-to-end latency from producer → consumer | Early SLA breaches before users scream |
data_streams.kafka.lag_seconds | Kafka lag per consumer group/partition | Consumer can’t keep up → risk of data loss |
data_streams.payload_size | Throughput (bytes in/out) | Cost, scaling, back-pressure symptoms |
DSM is pipeline-aware observability, not just host metrics.
2.3 Observability Pipelines
Observability Pipelines let you collect, transform, filter, and route logs/metrics within your infra before sending them to Datadog, SIEMs, data lakes, or blob storage.(Datadog Monitoring)
Common data-engineering uses:
- Redact PII before logs leave VPC
- Drop noise (e.g., overly chatty debug logs from some connector)
- Enrich events with team ownership, pipeline IDs, environment, cost center
- Branch routing: some logs to Datadog, all logs to S3/Lakehouse
Think of it as an ETL layer for observability data.
3. Example Architecture: Datadog on a Modern Data Platform
Imagine this stack:
- Sources: APIs, microservices, operational DBs
- Streaming: Kafka
- Processing: Flink/Spark streaming, dbt jobs, Python batch ETL
- Warehouse: Snowflake / BigQuery / Redshift
- Orchestration: Airflow / Dagster
- Monitoring: Datadog
High-level Datadog integration:
- Agents & SDKs
- Datadog Agent runs on K8s nodes / EC2 / containers.
- APM libraries emit traces and runtime metrics from apps/jobs.(Datadog Monitoring)
- Metrics
- Pipelines emit custom metrics:
etl.rows_processed,etl.duration_seconds,etl.failed,etl.cost_credits.
- Pipelines emit custom metrics:
- Logs
- Jobs log structured JSON with fields like
pipeline_name,dataset,env,team.
- Jobs log structured JSON with fields like
- Traces
- A single user request or event is traced from the frontend to the data pipeline that powers their dashboard.
- DSM
- Kafka pipelines show up as a graph with latency/lag per edge and queue.(Datadog Monitoring)
- Data Observability
- Data quality checks, anomalies, and lineage issues are surfaced as Datadog alerts.(Datadog Monitoring)
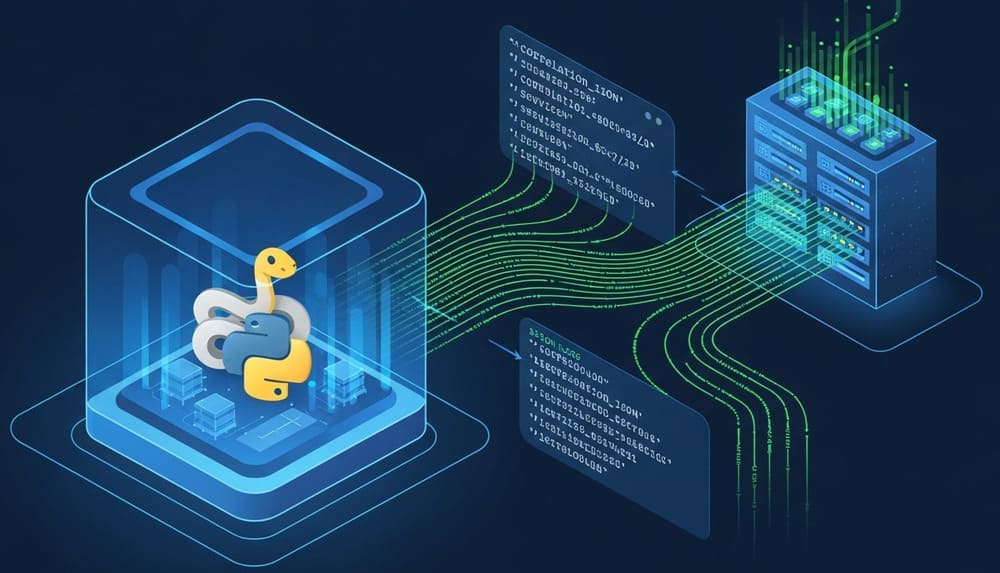
4. Concrete Example: Instrumenting a Python ETL Job
Let’s say you’ve got a Python batch job loading data into Snowflake. You want:
- Row count per run
- Duration
- Success/failure
- Link to logs
A minimal example with DogStatsD-style metrics:
import time
import random
from datadog import initialize, statsd

# Normally configured via env vars / agent config
initialize()

PIPELINE = "orders_daily_load"

def load_orders():
    start = time.time()
    status = "success"
    rows = 0

    try:
        # your real logic here
        rows = random.randint(50_000, 100_000)  # simulate
        time.sleep(random.uniform(5, 15))
        # raise Exception("Snowflake load failed")  # simulate error
    except Exception as e:
        status = "failure"
        # log exception here (structured log to stdout)
        print({"event": "pipeline_error", "pipeline": PIPELINE, "error": str(e)})
        raise
    finally:
        duration = time.time() - start
        # emit metrics
        tags = [f"pipeline:{PIPELINE}", f"status:{status}", "env:prod"]
        statsd.gauge("etl.duration_seconds", duration, tags=tags)
        statsd.count("etl.rows_processed", rows, tags=tags)
        statsd.increment("etl.run", tags=tags)

if __name__ == "__main__":
    load_orders()
On a Datadog dashboard, you can now plot:
- P95
etl.duration_secondsby pipeline sum:etl.rows_processedstacked by dataset- Errors via
count:etl.run{status:failure}
This is the bare minimum you should demand from every pipeline.
5. Example: Watching Kafka-Based Streaming Pipelines with DSM
Assume you have:
orders-api→ Kafka topicorders_raworders-normalizerconsumer → topicorders_cleanwarehouse-loaderconsumer → Snowflake
With Data Streams Monitoring and Datadog APM:(Datadog Monitoring)
- Each service is instrumented and knows which stream edge it’s on.
- DSM builds a topology map showing:
orders-api → orders_raw → orders-normalizer → orders_clean → warehouse-loader.
- You see:
data_streams.latency{start:orders-api,end:warehouse-loader}data_streams.kafka.lag_seconds{consumer_group:warehouse-loader}
When something breaks:
- If latency spikes but lag is low, your loader is slow (e.g., Snowflake bottleneck).
- If lag spikes, your consumer cannot keep up → scale it or fix its performance.
- If topology shows a broken edge, a service stopped consuming or producing.
This is way more useful than “CPU utilization > 80% on node-12”.
6. Best Practices for Data Engineers Using Datadog
6.1 Design Metrics Like You Design Schemas
Bad metrics are as painful as bad schemas.
Do:
- Use a consistent naming convention:
etl.rows_processed,etl.duration_seconds,etl.errors,stream.lag_seconds.
- Tag aggressively (this is the key):
pipeline,dataset,env,team,source_system,priority,sla_tier.
- Emit metrics at logical boundaries:
- After extraction, after transform, after load.
Don’t:
- Dump thousands of random metrics with no tags.
- Use free-form text in metric names (cardinality explosion, billing pain).
6.2 Tame Cardinality Before It Destroys Your Bill
Datadog pricing is sensitive to metric + tag combinations and event volume.(Datadog Monitoring)
Watch out for:
- Tags like
user_id,session_id,query_hashon high-volume metrics. - Logging full payloads for every message in a hot topic.
Use Observability Pipelines to:(Datadog Monitoring)
- Drop useless high-cardinality fields.
- Sample or aggregate noisy logs.
- Route verbose logs to cheap storage (S3/lake), send only summaries to Datadog.
Brutal truth: if you don’t manage cardinality, your Datadog bill will punch you in the face.
6.3 Make Pipelines First-Class Citizens
Most teams monitor infra but ignore pipelines until something explodes.
Set a hard rule:
“No pipeline goes to prod without basic Datadog metrics, logs, and alerts.”
At a minimum:
- For each pipeline:
- Metrics: row count, duration, success/failure, cost.
- Alerts:
- No runs in X hours when a run is expected.
- Failure rate > 0 over last N runs.
- Row count deviates from 7-day average by > Y%.
- For streaming:
- Kafka lag alerts per consumer group.
- DSM latency alerts for key producer→consumer paths.
6.4 Correlate Data Issues with App Behavior
Datadog’s strength is correlating traces, metrics, logs, and dashboards🙁Datadog Monitoring)
Practical workflows:
- From a BI or API latency spike:
- Jump from app/service dashboard → DSM view → see pipeline lag → root cause.
- From a data-quality incident:
- Data Observability alert → pipeline metrics → offending job logs.
Don’t stare at tools in isolation; wire them into one investigative path.
7. Common Pitfalls (And How to Avoid Them)
- “Infra-only” mindset
- Symptom: you only monitor EC2, K8s, DB CPU.
- Fix: instrument the logical data flow (pipelines, topics, datasets) first.
- Alert fatigue / useless alerts
- Symptom: Slack is flooded, nobody reacts.
- Fix: fewer alerts, but tied directly to user impact/SLA (e.g., “orders_daily missing for 2 days”, not “CPU > 70%”).
- Zero ownership metadata
- Symptom: nobody knows who owns a broken pipeline.
- Fix: tag everything with
team,service_owner,data_domain. Enforce via CI.
- Ignoring cost until finance escalates
- Symptom: Datadog line item suddenly scary.
- Fix: monitor usage and cardinality; use Observability Pipelines to downsample and route.
- No staging environment for observability
- Symptom: new logs/metrics/alerts blow up prod signal.
- Fix: treat observability as code; test dashboards/alerts in non-prod first.
8. Conclusion & Takeaways
Datadog is not just “yet another dashboard.” Used properly, it becomes a data observability layer over your warehouses, pipelines, and streams.
If you’re a data engineer, your bar should be:
- Every pipeline has observable metrics, logs, and (ideally) traces.
- Streaming systems use Data Streams Monitoring for real-time health.
- Observability data is cleaned, enriched, and controlled via Observability Pipelines.
- Alerts are few but brutal: when they fire, you know something business-critical is at risk.
If today your monitoring stops at “CPU high” and “job failed”, you’re flying blind. Your next sprint should include making data observability a first-class feature, not an afterthought.
Image Prompt
“A clean, modern data architecture diagram showing a Datadog-based observability layer across a streaming data pipeline: services producing to Kafka, consumers processing data, a cloud data warehouse, and Datadog visualizing metrics, logs, traces, and a topology map — minimalistic, high-contrast, 3D isometric style.”
Tags
#Datadog #DataEngineering #DataObservability #Kafka #APM #StreamingData #ETL #Monitoring #DevOps #Observability
Datadog, Data Engineering, Data Observability, Kafka, APM, Streaming Data, ETL Pipelines, Monitoring, DevOps, Observability


