AppDynamics for Data & Backend Engineers: Turning APM Metrics into Real Performance Wins
Imagine this: checkout latency quietly creeps from 300 ms to 3 seconds. Dashboards look “fine”, CPU is normal, DB isn’t obviously on fire—but customers are dropping carts and finance is pinging you in Slack.
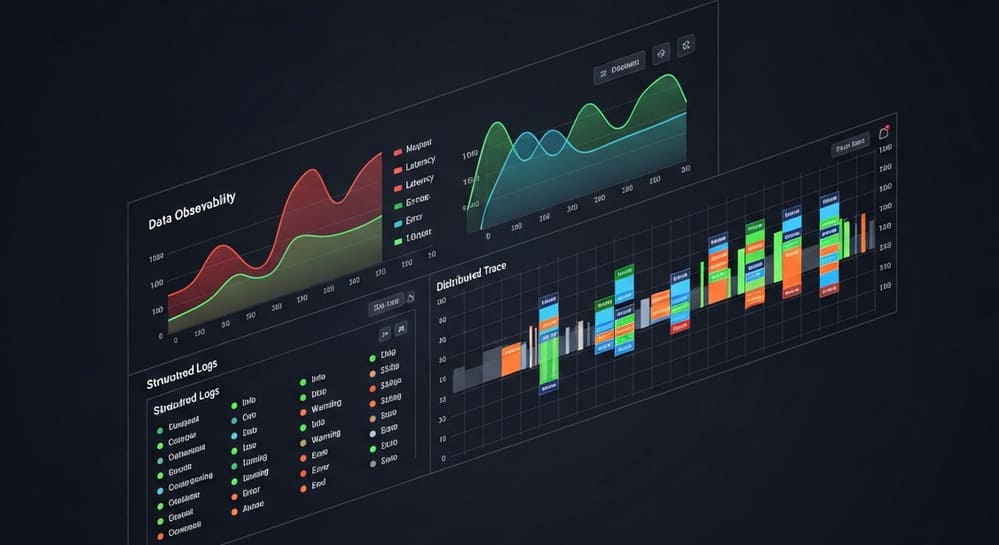
This is exactly the class of problem AppDynamics is built for: following a user request end-to-end across services, queues, and databases, and telling you where and why it got slow.
In this article, we’ll look at AppDynamics from a data/backend engineer’s perspective: what it is, how it’s wired, how it actually helps you debug real incidents, and what to watch out for when rolling it out.
What Is AppDynamics (and Why Should Data People Care)?
AppDynamics (now Cisco AppDynamics) is an Application Performance Monitoring (APM) platform that traces requests across your stack, correlates them into business transactions, and surfaces performance, errors, and business impact in one place.(Techoral)
Key idea: instead of just watching servers or pods, AppDynamics models how user-facing actions (like “Place Order” or “Run Monthly Billing ETL”) flow through services, databases, and external APIs—and shows where the time is actually spent.(AppDynamics Documentation)
As a data or backend engineer, that means:
- You see which service or query is slowing a critical user journey.
- You get snapshots of slow transactions with call graphs and DB calls.
- You can correlate application metrics with business metrics (orders, logins, SLA breaches).
AppDynamics Architecture in 5 Minutes
At a high level, an AppDynamics deployment has four main pieces:
1. Agents (App, Infra, Database)
AppDynamics uses agents that you install alongside your workloads:
- Application agents – instrument Java, .NET, Node.js, Python, PHP, etc. They detect entry points and trace business transactions across tiers.(AppDynamics Documentation)
- Server / infrastructure agents – monitor CPU, memory, disks, containers, cluster health.
- Database agents – capture database performance metrics and query stats for supported engines.(AppDynamics Documentation)
These agents sit in your app runtime or near your DB, sending metrics, traces, and events to the Controller.
2. Controller
The Controller is the “brain” of AppDynamics:
- Receives all metrics/traces from agents.
- Builds the application flow maps and transaction topologies.
- Applies baselines, alerts, and health rules.
- Powers the web UI where engineers explore slow transactions and metrics.(AppDynamics Documentation)
3. Events Service & Analytics
Behind the scenes, the Events Service stores high-cardinality events: transaction analytics, logs, browser/mobile events, etc. This powers:
- Transaction Analytics
- Log Analytics
- Browser/Mobile analytics
- Advanced queries and dashboards that mix business and performance data.(AppDynamics Documentation)
4. Application Model: Business Apps, Tiers, Nodes, Business Transactions
AppDynamics uses a layered model:(AppDynamics Documentation)
- Business Application – top-level container (e.g.,
ecommerce-prod,payments-prod). - Tiers – logical group of nodes (e.g.,
web,api,payments-service,orders-service). - Nodes – individual JVMs/containers/servers.
- Business Transactions (BTs) – end-to-end paths that fulfill a user action (e.g.,
Checkout,Login,SearchProducts).
This BT concept is the secret sauce: you don’t just see “service latency”, you see “Checkout is slow, and 80% of that time is spent in PaymentsService → Postgres”.
Core Features You’ll Actually Use
Business Transaction Monitoring
AppDynamics automatically discovers common entry points (HTTP endpoints, message queue consumers, etc.) and groups them into business transactions.(AppDynamics Documentation)
For each BT you see:
- Throughput (calls/min)
- Average / percentile response time
- Error rates
- “Normal vs slow vs very slow vs stalled” call distributions(AppDynamics Documentation)
You also get transaction snapshots that show a call graph from web tier → services → DB calls, with timings per segment.
Database Visibility
For data folks, Database Visibility is where AppDynamics becomes interesting:
- Per-database and per-query metrics (latency, throughput, errors).
- Current and historical performance views.
- Database objects and configuration changes in one place.(AppDynamics Documentation)
- Correlation between specific business transactions and their DB performance (e.g., “Checkout calls this slow query to
ordersDB”).(AppDynamics Documentation)
Analytics & Log Correlation
With Analytics enabled you can:
- Capture transaction-level attributes (user ID, order ID, region, plan) via data collectors.
- Query transactions by attributes (“Show me US-East checkouts with response time > 5 seconds”).
- Correlate logs with transactions so you can jump from a slow trace to relevant log lines.(AppDynamics Documentation)
This turns AppDynamics into a lightweight “APM + business analytics + log lens” for production traffic.
Cloud-Native & End-User Monitoring
Modern deployments usually combine:
- Cluster/Container monitoring (Kubernetes cluster agents).
- Browser & Mobile RUM (real user monitoring) to see front-end performance and errors.
- Optional serverless / Lambda / Azure integrations.(AppDynamics Documentation)
Example: Debugging a Slow “Place Order” Flow
Let’s walk through a realistic scenario.
The Symptom
- SLO: 95% of “Place Order” calls < 1 second.
- On-call gets a page: “Place Order BT latency > 4s for 10 minutes.”
- At the same time, error budget for the checkout service is being burned.
Step 1 – Open the Business Transaction Dashboard
In AppDynamics:
- Go to Business Transactions →
PlaceOrder. - You see:
- Response time baseline 800–1200 ms.
- Current average: 4000 ms.
- Most calls marked as “Very Slow” or “Stalled”.(AppDynamics Documentation)
Step 2 – Inspect the Transaction Flow Map
The flow map for PlaceOrder shows:
web-tier→checkout-api→payments-service→orders-db.- A red edge on
payments-service → payments-db.
Hovering the edge shows:
- Average DB call time: 3500 ms.
- Call volume increased 5x in the last 10 minutes.
Step 3 – Drill into Slow DB and Remote Service Calls
From the BT dashboard you open Slowest DB & Remote Service Calls and see:(AppDynamics Documentation)
SELECT * FROM payments WHERE user_id = ? AND status = ? ORDER BY created_at DESC LIMIT 1- Execution time: 3000–4000 ms for many calls.
- Plan uses a table scan, not the expected index.
You cross-check with Database Visibility and see:
- Index
idx_payments_user_status_createdwas dropped 1 hour ago during a schema change.(AppDynamics Documentation)
Step 4 – Fix and Verify
You:
- Recreate the index on
payments(user_id, status, created_at DESC). - Watch AppDynamics:
- DB call time drops back to < 50 ms.
PlaceOrderBT response time returns to baseline.- Error budget burn stops.
Zero guesswork. You didn’t have to SSH into random pods or trawl log files for 30 minutes—you went straight from SLO breach → slow BT → slow DB call → missing index.
Best Practices for Using AppDynamics in Real Teams
1. Model Around User Journeys, Not Microservices
Bad pattern: one “business application” per microservice with 200+ generic endpoints.
Better:
- Define Business Applications at the level of a product or domain (
ecommerce,payments,data-platform). - Within each, define BTs that match real workflows:
CheckoutViewProductGenerateInvoiceRunDailyETLJob
This makes health dashboards match how people think about the system.
2. Avoid “Business Transaction Explosion”
If every URL parameter becomes a separate BT, you end up with thousands of low-volume transactions that are impossible to manage.
- Customize BT discovery rules.
- Group by logical endpoint (e.g.,
/api/orders/{id}). - Use data collectors to capture attributes (order ID, user ID) instead of creating new BTs.(AppDynamics Documentation)
3. Treat ETL / Data Pipelines as First-Class Citizens
Most teams only instrument web traffic. That’s a mistake.
For data workflows:
- Wrap long-running jobs (Spark, Airflow DAGs, dbt, custom Python) with AppDynamics agents where possible.
- Model ETL phases as BTs:
ExtractFromERPTransformSalesFactLoadWarehouse
- Capture:
- Rows processed
- Source system
- Target table
- SLA threshold
Now you can answer: “Which ETLs are consistently flirting with the SLA?” straight from AppDynamics.
4. Use Baselines Instead of Only Static Thresholds
AppDynamics builds dynamic baselines from historical behavior and alerts when current metrics deviate too far.(AppDynamics Documentation)
That’s far better than hard-coded “> 2s is bad” rules, especially for spiky workloads.
5. Integrate with Incident Management, Not Just Dashboards
Dashboards don’t wake people up. Alerts do.
- Wire AppDynamics health rules → PagerDuty/Slack/Teams.
- Align BT health rules with your SLOs.
- Include links in alerts back to:
- BT dashboards
- Specific snapshots
- Related database metrics
Common Pitfalls (and How to Avoid Them)
Pitfall 1 – “We Installed the Agent, So We’re Done”
Just dropping agents into JVMs or containers will give some data, but usually:
- BTs are messy.
- Names are auto-generated.
- No one knows which dashboard actually matters.
Fix: Spend dedicated time modeling applications, tiers, and BTs. Treat it like designing a data model.
Pitfall 2 – Too Many Charts, Not Enough Signals
AppDynamics can produce a lot of metrics. If you dump everything into dashboards:
- No one knows where to look during an incident.
- Important signals get buried in noise.
Fix:
- Start with 3–5 key BTs and few critical DBs.
- Build one “Golden Signals” view per domain:
- Latency
- Error rate
- Traffic
- Saturation (CPU, DB connections, queue depth)
Pitfall 3 – Ignoring the Database Layer
If you only instrument the app tier, every problem looks like “the service is slow”.
Fix:
- Deploy Database Agents and configure Database Visibility for major databases.(AppDynamics Documentation)
- Watch DB metrics in context of BTs, not in isolation.
Pitfall 4 – Treating AppDynamics as an Ops-Only Tool
If only ops/SRE look at AppDynamics, developers continue to ship changes blind.
Fix:
- Make AppDynamics part of dev workflows:
- Add links to BT dashboards in runbooks.
- Use snapshots to triage performance bugs.
- Review BT and DB metrics after big releases.
Where AppDynamics Fits in a Modern Observability Stack
AppDynamics is strongest at application-centric performance and business transaction visibility.
Rough mental model:
- Prometheus/Grafana – infra and service metrics (CPU, memory, custom metrics).
- ELK / OpenSearch / Splunk – logs and unstructured search.
- Jaeger / OpenTelemetry / Tempo – distributed tracing (often more low-level and flexible).
- AppDynamics – business transaction-centric APM with integrated DB visibility and analytics.
In many orgs, AppDynamics sits alongside these tools, providing the user-journey view: “For this checkout, what happened, where, and how did it affect the business?”
Conclusion & Takeaways
If you strip away the marketing, AppDynamics is about one thing: following real user and data workflows across your stack and showing you where they hurt.
Key takeaways:
- Model business transactions first; agents and metrics second.
- Turn on Database Visibility early; most real bottlenecks hide there.
- Use dynamic baselines and health rules tied to SLOs.
- Treat ETL and data jobs as first-class BTs, not black-box batch jobs.
- Integrate AppDynamics into incident and release workflows, not just as a nice dashboard.
Get those right, and AppDynamics stops being “another enterprise tool” and becomes a very opinionated, very useful performance coach for your production systems.
Image Prompt (for DALL·E / Midjourney)
“A clean, modern monitoring dashboard showing a distributed microservices architecture with highlighted slow paths and database nodes, inspired by AppDynamics-style APM, minimalistic 3D isometric style, dark background, high contrast, subtle neon accents.”
Tags
Hashtags:
#AppDynamics #APM #Observability #DataEngineering #PerformanceMonitoring #DatabasePerformance #Microservices #SRE
Keyword list:
AppDynamics, Application Performance Monitoring, business transactions, Database Visibility, data engineering, observability, performance tuning, microservices, SRE, production monitoring


