Alert Fatigue in DevOps: How to Design Monitoring Alerts People Don’t Ignore
If every on-call shift feels like babysitting a slot machine of random alerts, you don’t have a monitoring problem — you have an alert design problem. Alert fatigue is what happens when engineers are paged so often (and so badly) that they start to ignore even the critical ones. The good news: this is fixable with disciplined alert design, not more dashboards.
What Is Alert Fatigue (and Why It’s So Dangerous)?
Alert fatigue is when the signal-to-noise ratio of your alerts is so bad that humans stop reacting:
- People mute channels or notification rules.
- On-call responds slower, or not at all.
- Real incidents get buried under “known noisy” alerts.
- You burn out your best engineers and still miss SLAs.
The root cause is almost always the same: too many alerts that don’t map to real user or business impact.
If an alert can fire and you’d still say “meh, I’ll look tomorrow,” it probably shouldn’t page a human.
A Healthy Alert System: Concepts and Architecture
Think of your alerting system as a funnel:
- Raw signals
- Metrics (CPU, latency, errors, queue depth)
- Logs (exceptions, 5xx counts, auth failures)
- Traces (slow spans, failed dependencies)
- Derived conditions / SLOs
- “99% of requests under 300 ms in 5 minutes”
- “Error rate < 0.5% over 30 minutes”
- Alert rules
- Attach severity (P1–P4)
- Define who owns it
- Link to a runbook
- Notification routing
- On-call rotation (PagerDuty, OpsGenie, etc.)
- Slack/MS Teams channels
- Email for low-priority chatter
- Human response
- Triage → Mitigate → Follow-up (postmortem / ticket)
A good alerting system aggressively filters at each stage so that only actionable, urgent conditions wake people up.
Principles for Alerts That Don’t Get Ignored
1. Tie Alerts to User and Business Impact
If the alert isn’t obviously about user pain or business risk, it’s probably noise.
Good alert candidates:
- “Checkout error rate > 2% for 5 minutes”
- “p95 latency on /login > 800 ms for 10 minutes”
- “Kafka consumer lag > 50k for 15 minutes (risk of SLA breach)”
Bad alert candidates:
- “CPU > 70% for 1 minute”
- “Disk usage > 60%”
- “GC time > 20%”
Infra metrics can matter, but only when they clearly predict real impact. Otherwise, leave them for dashboards, not pages.
2. Severity Levels With Real Behavioral Rules
Stop treating all alerts the same. Define clear severities and what they mean operationally.
| Severity | Meaning | Response expectation | Example |
|---|---|---|---|
| P1 | Major outage / data loss | Wake someone now (24/7) | 80%+ traffic failing |
| P2 | Degraded but working | 24/7, but can wait a few minutes | Latency 2x normal, some retries |
| P3 | Needs attention in working hours | Business hours only | One replica down, redundancy still OK |
| P4 | Informational / trend / housekeeping | Email/slack digest | Disk at 70%, will need cleanup this week |
If you page someone (P1/P2), the message should answer:
“Why do I need to care right now?”
3. Make Alerts Actionable (Runbooks or It Didn’t Happen)
An alert without a clear next step is basically spam.
Each alert should answer:
- What’s broken?
“Checkout error rate > 2% in us-east-1.” - Why this matters?
“Users can’t complete purchases.” - What do I do first? (runbook)
“Check payment gateway health dashboard → Fallback to provider B if provider A is failing.”
If you don’t have a runbook, write at least a short checklist in the alert description.
4. Use SLO-Based Alerting, Not Threshold Whack-a-Mole
Classic mistake: arbitrary thresholds all over the place.
Better approach: define Service Level Objectives (SLOs) and alert on error budget burn:
- SLO: “99.5% of /api requests succeed over 30 days”
- Error budget: 0.5% allowed failures
- Page when you burn error budget too fast, e.g.:
- “2% of error budget burned in 1 hour” → P1
- “5% burned in 6 hours” → P2/3
This keeps alerts tightly aligned with real reliability goals instead of random metric spikes.
Example: A Prometheus Alert That Doesn’t Suck
Here’s a simplified example of a Prometheus alert for HTTP error rate:
groups:
  - name: api-alerts
    rules:
      - alert: HighErrorRateCheckout
        expr: |
          sum(rate(http_requests_total{
            service="checkout",
            status=~"5.."
          }[5m]))
          /
          sum(rate(http_requests_total{
            service="checkout"
          }[5m]))
          > 0.02
        for: 10m
        labels:
          severity: P1
          team: payments
        annotations:
          summary: "High 5xx error rate on /checkout"
          description: |
            Checkout 5xx rate > 2% for 10m.
            Users may be unable to complete purchases.
            Runbook: https://runbooks.internal/payments/checkout-5xx
Why this is decent:
- It measures user-facing failure (5xx rate), not CPU.
- It uses a time window (
for: 10m) to avoid flapping on quick blips. - It has severity, owner team, and a direct runbook link.
- The description explains impact in plain language.
Best Practices to Prevent Alert Fatigue
1. Set a “Noise Budget”
Treat alert noise like tech debt. Define a max acceptable volume, e.g.:
- “No more than 2–3 pages per engineer per week.”
- “No more than 10 P1/P2 alerts per service per month.”
When you exceed it, you must:
- Tune thresholds.
- Add hysteresis / longer
fordurations. - Consolidate or delete duplicate alerts.
2. Deduplicate and Correlate
Five alerts about the same underlying issue is how you burn humans.
Techniques:
- Grouping/correlation in your alerting tool:
Group by service, region, incident ID. - Root cause alerts only:
Alert on “database unavailable,” not “500 services can’t reach DB.” - Maintenance windows / silencing:
Silence alerts during planned maintenance, deployments, etc.
3. Route to the Right People
Alert fatigue often comes from everyone seeing everything.
- Map services → owning teams.
- Use labels (
team,service,env) to route precisely. - Create separate channels for:
- Prod P1/P2
- Non-prod alerts
- Noise / experiments / early-stage alerts
If “#alerts” is just a firehose of every environment and every service, your brain will treat it as background radiation.
4. Regular Alert Reviews (On-Call Health)
Once a sprint (or at least once a month):
- Review all P1/P2 alerts:
- Which ones had no action taken?
- Which ones were resolved automatically?
- Which ones had useless or missing runbooks?
For each noisy alert, decide:
- Fix it (tune / make it SLO-based).
- Downgrade severity (P2 → P3/P4).
- Delete it (if nobody cares, it shouldn’t exist).
If you’re serious, make “alert review” part of your incident management or SRE process, not a nice-to-have.
5. Make On-Call Humane
Even the best alerts will fail if your on-call system is inhumane:
- No one should be on 24/7 call for weeks.
- Rotations should be:
- Short (1 week is common).
- Fair (load balanced).
- Backed by escalation policies.
If people are exhausted, they will ignore alerts. That’s not a character flaw, it’s biology.
Common Alerting Pitfalls (And How to Fix Them)
1. Infra Alerts for Everything
- Problem: You page on CPU, memory, disk, GC, network without context.
- Fix: Only page when these metrics clearly correlate to user-visible issues.
2. Flappy Alerts
- Problem: Alerts fire and resolve every few minutes due to noisy metrics.
- Fix: Use:
- Time windows (
for: 5m,for: 10m) - Smoothing (e.g., rates/averages)
- Higher thresholds
- Time windows (
3. No Ownership
- Problem: Alerts go to “general” channels; nobody feels responsible.
- Fix: Each alert must have:
- A clear owner team.
- A clear escalation path.
4. Alerts With No Runbooks
- Problem: On-call has to reverse-engineer what to do at 3 AM.
- Fix: Require a minimal runbook for any P1/P2 before enabling the alert.
5. “Set and Forget” Alerts
- Problem: Alerts created during an incident never get revisited.
- Fix: After each incident, improve:
- Detection (new/updated alerts)
- Clarity (better messages/runbooks)
- Noise control (tuning/removing useless alerts)
Conclusion: Designing Alerts Like a Product, Not a Byproduct
Alert fatigue isn’t just “too many alerts” — it’s a symptom of lazy alert design and lack of ownership.
If you treat alerts as a product for your on-call engineers, you’ll design them differently:
- They’ll be rare but important.
- They’ll describe real impact, not random metrics.
- They’ll be actionable, with clear runbooks.
- They’ll be continuously tuned based on feedback.
Do that, and your team will stop ignoring alerts — because the alerts will finally deserve attention.
Internal Link Ideas (for a Blog / Docs Hub)
You could internally link this article to:
- “How to Define SLOs and Error Budgets for Your Services”
- “Building Effective Runbooks for On-Call Engineers”
- “Monitoring vs Observability: What Data Engineers Really Need”
- “Incident Management 101: Blameless Postmortems and Learning Loops”
- “Designing Dashboards That Actually Help During Incidents”
Image Prompt (for DALL·E / Midjourney)
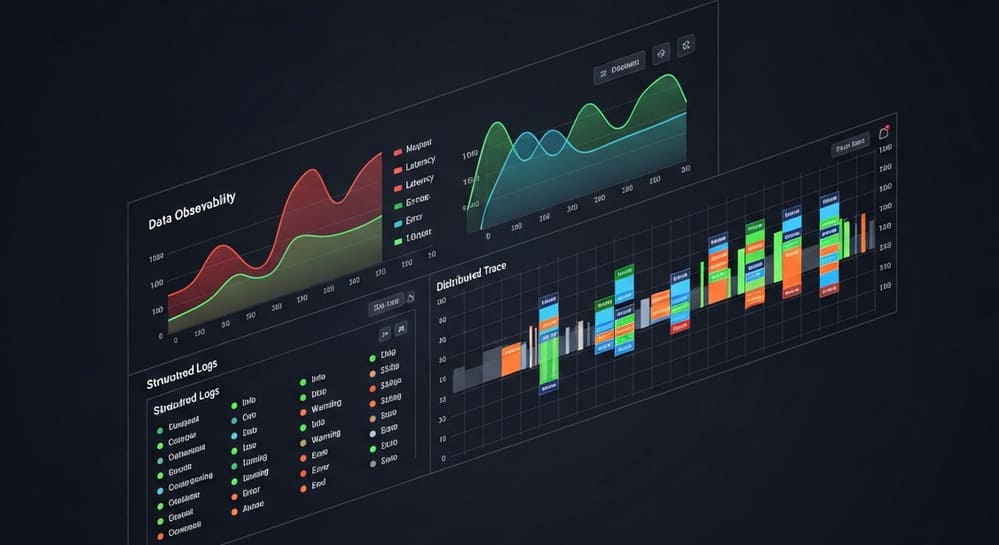
“A clean, modern DevOps monitoring dashboard showing a few high-priority alerts clearly highlighted among many muted signals, representing reduced alert fatigue — minimalistic, high contrast, 3D isometric style, dark background, neon accents.”



Leave a Reply