The Seven Pillars of Modern Data Engineering Excellence
In today’s data-driven world, where volume, velocity, and variety are continuously pushing boundaries, true mastery in data engineering transcends traditional methods. It’s about creating systems that not only store and process data but also transform it into actionable insights. I like to call this holistic approach “The Seven Pillars of Modern Data Engineering Excellence.” These pillars are both a roadmap and an ethos for data and ML engineers striving for greatness. Let’s explore each pillar and see how they can elevate your craft.
Pillar 1: The Art of Data Flow Optimization
- Identify Bottlenecks: Just as water pressure builds at a clogged pipe, data bottlenecks occur where processing slows down. Tools like AWS CloudWatch or Databricks’ monitoring help pinpoint these choke points.
- Self-Regulating Systems: Design your system to automatically adjust to varying loads. For example, adaptive scaling in Snowflake or AWS auto-scaling functions like a thermostat that keeps the system at an optimal “temperature.”
- Pressure Release Valves: Create failover systems (using AWS Step Functions, for instance) to ensure that if one pipeline fails, data can reroute seamlessly, just like emergency overflow systems in plumbing.
- Monitor Flow Temperature: Constantly check latency and throughput with Python scripts or AWS monitoring tools. This real-time feedback helps ensure your system operates smoothly.
Pillar 2: The Alchemy of Data Quality
- Strict Data Governance: Use Snowflake’s built-in governance features to enforce clear policies on data usage, quality, and security. Establish data contracts that define quality standards.
- Automate Data Cleansing: Utilize Python libraries like pandas or leverage Databricks for large-scale transformations. For example, a retail company might automate cleansing of sales data, eliminating duplicates and correcting errors before analytics.
- Continual Data Profiling: Regularly assess your data using SQL-based tools like AWS Athena or custom Python scripts. This ongoing monitoring ensures your datasets remain reliable and accurate.
Pillar 3: The Architecture of Scalability
- Cloud-Native Solutions: Leverage AWS services such as S3 for storage and EC2 for compute, which scale on demand. Snowflake’s architecture, which separates compute from storage, allows for independent scaling and high concurrency.
- Microservices Architecture: Break down your data processes into independent microservices. Databricks’ distributed computing model is a prime example, where each microservice can be scaled separately, ensuring efficiency and fault tolerance.
- Medallion Architecture: Organize your data into Bronze (raw data), Silver (cleaned and conformed data), and Gold (curated, business-ready data) layers. This structure not only enhances data quality but also allows each layer to scale and evolve independently.
Pillar 4: The Symphony of Integration
Data isn’t meant to exist in isolation; it’s a harmonious symphony of interconnected information.
- API-First Approach: Use AWS API Gateway or frameworks like Python’s Flask to create APIs that allow seamless communication between disparate systems. This ensures that your data is accessible and interoperable across platforms.
- Event-Driven Architecture: Implement AWS Lambda or Apache Kafka to trigger real-time actions as data events occur. For example, an e-commerce platform might use Kafka to update inventory and send personalized recommendations the moment a customer makes a purchase.
- Holistic Orchestration: Envision your data ecosystem as an orchestra where every service, from ingestion to analysis, plays in harmony, delivering timely and coordinated insights.
Pillar 5: The Fortress of Data Security
- Encryption Everywhere: Use AWS KMS and Snowflake’s encryption features to protect your data at rest and in transit. Encryption ensures that even if data is intercepted, it remains secure.
- Access Control: Implement fine-grained access controls using AWS IAM and Snowflake’s role-based access control (RBAC). This ensures that only authorized users can access sensitive information.
- Proactive Threat Monitoring: Regularly audit your systems with automated security checks and penetration testing. Early detection of vulnerabilities is key to maintaining a secure environment.
Pillar 6: The Legacy of Documentation
- Automate Documentation: Use Python scripts to generate up-to-date documentation from your code and pipelines. Automation ensures that documentation evolves as your system does.
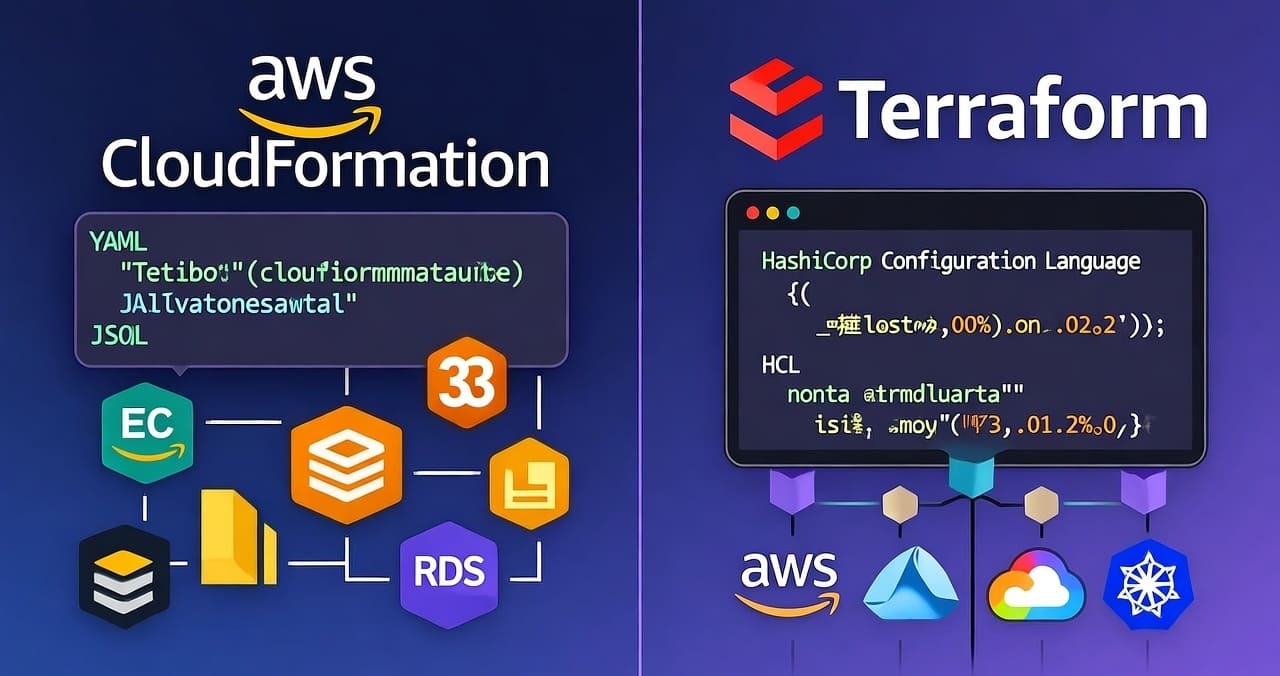
- Live Documentation: Leverage tools like AWS CloudFormation to document infrastructure as code. This real-time blueprint is invaluable for onboarding new team members and for troubleshooting issues.
- Maintain a Knowledge Base: A well-documented system serves as a reference point for best practices, helping your team maintain high standards and quickly resolve issues.
Pillar 7: The Vision of Continuous Learning
In the fast-paced realm of data engineering, standing still is not an option.
- Stay Updated: Regularly engage with communities around Python, Snowflake, Databricks, and AWS. Attend webinars, conferences, and online courses to keep abreast of the latest trends.
- Experimentation: Utilize platforms like AWS SageMaker or Databricks notebooks to test new algorithms and data techniques. Continuous experimentation drives innovation and improves overall system performance.
- Knowledge Sharing: Encourage a culture of learning within your team. Regularly share insights and breakthroughs, ensuring that collective knowledge grows along with your systems.
Conclusion
Modern data engineering is not just about managing data—it’s about mastering its flow, ensuring its quality, and building systems that scale and integrate seamlessly. The Seven Pillars of Modern Data Engineering Excellence serve as a comprehensive blueprint for achieving these goals. By optimizing data flow, enforcing strict data quality, building scalable architectures, integrating systems harmoniously, securing data rigorously, maintaining robust documentation, and fostering continuous learning, you transform your data environment into a powerful engine for innovation.
Actionable Takeaway: Evaluate your current data architecture against these seven pillars. Identify areas for improvement, whether it’s implementing a Medallion structure in Snowflake, automating data cleansing, or integrating API-first and event-driven architectures. Each pillar offers a pathway to not only manage data but also to unlock its full potential.
What steps are you taking to elevate your data engineering practices? Share your insights and join the conversation as we shape the future of data excellence together!
#DataEngineeringExcellence #SevenPillars #MedallionArchitecture #Snowflake #DataQuality #Scalability #DataIntegration #CloudData #TechInnovation #DataOptimization









Leave a Reply