25 Apr 2025, Fri

Kibana

Kibana: Data Visualization Dashboard for Elasticsearch

Kibana: Data Visualization Dashboard for Elasticsearch

In the modern data landscape, the ability to search, analyze, and visualize vast amounts of data in real-time has become essential. Enter Kibana—an open-source data visualization and exploration tool designed specifically for Elasticsearch. As the “window” into the Elastic Stack, Kibana transforms complex data stored in Elasticsearch into actionable insights through intuitive visualizations and powerful analytics capabilities.

The Heart of the Elastic Stack

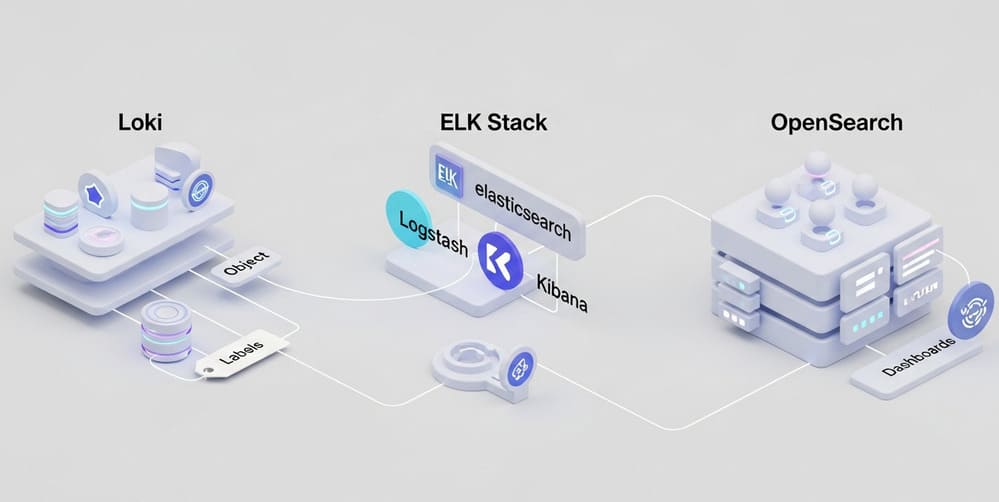
Kibana serves as the visualization layer in what was traditionally known as the ELK Stack (Elasticsearch, Logstash, Kibana), now expanded into the Elastic Stack with the addition of Beats. While Elasticsearch excels at storing, searching, and analyzing massive volumes of data, Kibana makes this data accessible and understandable through its user-friendly interface.

The synergy between Elasticsearch and Kibana creates a powerful platform for:

  • Log and metrics analysis: Monitoring system performance and troubleshooting issues
  • Security analytics: Detecting threats and investigating security incidents
  • Business intelligence: Tracking KPIs and visualizing business metrics
  • Application performance monitoring: Understanding user behavior and application health
  • Geospatial analysis: Visualizing location-based data patterns

Key Features That Set Kibana Apart

Discover: Intuitive Data Exploration

The Discover interface allows users to:

  • Search through data using Elasticsearch’s powerful query language
  • Filter results with a point-and-click interface
  • View document details and field statistics
  • Create and save search queries for future use
  • Customize time ranges with absolute or relative values

This interactive exploration environment makes it possible to sift through terabytes of data without writing complex queries—though advanced users can leverage the full power of Elasticsearch’s query DSL when needed.

Visualize: Bringing Data to Life

Kibana offers a rich library of visualization types:

  • Line, area, and bar charts: For time-series data and trend analysis
  • Pie charts and donut charts: For composition and proportion analysis
  • Data tables: For detailed numerical analysis
  • Metric visualizations: For at-a-glance KPIs
  • Coordinate maps and region maps: For geospatial data
  • Heat maps: For displaying density and distributions
  • Vega and Vega-Lite: For custom visualization specifications

What makes these visualizations powerful is their interactive nature—users can drill down, filter, and explore data dynamically rather than being limited to static reports.

Dashboard: Unified Data Storytelling

Kibana’s dashboards bring together multiple visualizations into cohesive, interactive data narratives:

  • Combine diverse visualization types on a single canvas
  • Apply global filters across all visualizations
  • Share interactive dashboards with stakeholders
  • Export to PDF for static reporting
  • Set up auto-refresh for real-time monitoring

These dashboards serve as command centers for operations teams, executive overviews for management, and analytical workbenches for data scientists.

Canvas: Presentation-Ready Visualizations

Canvas takes Kibana visualizations to the next level with:

  • Pixel-perfect layouts and positioning
  • Custom visual elements and infographics
  • Direct data connections to Elasticsearch
  • Live data updates in presentation mode
  • Animated transitions between workpads

This feature bridges the gap between data analytics and presentation, eliminating the need to export to design tools for creating polished reports.

Lens: No-Code Visualization Builder

Introduced in newer versions, Lens simplifies visualization creation:

  • Drag-and-drop field selection
  • Automatic chart suggestion based on data types
  • Quick switching between visualization types
  • Simplified metric calculations
  • Instant preview of visualization changes

Lens makes data visualization accessible to non-technical users while maintaining the power and flexibility Kibana is known for.

Real-World Applications

DevOps and IT Operations

DevOps teams rely on Kibana for:

  • Log analysis: Centralizing and analyzing logs from distributed systems
  • Infrastructure monitoring: Tracking server health, network traffic, and resource utilization
  • Alerting: Setting notifications for anomalies or threshold breaches
  • Incident investigation: Exploring system behavior during outages
  • Capacity planning: Analyzing usage trends to forecast future needs

A typical DevOps dashboard might combine metrics on server CPU/memory usage, application response times, error rates, and deployment markers—giving teams a complete picture of operational health.

Security Operations

Security teams leverage Kibana for:

  • SIEM functionality: Detecting and investigating security threats
  • User behavior analytics: Identifying anomalous access patterns
  • Threat hunting: Proactively searching for indicators of compromise
  • Compliance reporting: Generating required security documentation
  • Incident response: Coordinating security event management

Kibana’s timeline visualization is particularly valuable for security analysts, allowing them to correlate events across multiple systems and time periods.

Business Analytics

Beyond technical use cases, Kibana serves business users through:

  • E-commerce analytics: Tracking sales, conversions, and customer journeys
  • Marketing dashboards: Measuring campaign performance and channel effectiveness
  • Product usage metrics: Understanding feature adoption and user engagement
  • Customer service monitoring: Tracking support tickets and resolution times
  • Executive KPI dashboards: Providing high-level business health metrics

The ability to combine technical and business data in a single platform makes Kibana particularly powerful for organizations seeking to break down data silos.

Getting Started with Kibana

Setting up a basic Kibana environment is remarkably straightforward:

  1. Install Elasticsearch: The storage and search engine
  2. Install Kibana: The visualization layer
  3. Connect data sources: Using Logstash, Beats, or direct API calls
  4. Define index patterns: Telling Kibana how to interpret your data
  5. Create visualizations: Building your first charts and graphs
  6. Assemble dashboards: Combining visualizations into cohesive views

For those wanting to experiment without installation hassles, Elastic Cloud offers a managed service with a free trial period.

Basic Configuration Options

Kibana’s behavior can be customized through:

  • kibana.yml: The main configuration file
  • Role-based access control: For securing dashboards and data
  • Custom CSS: For white-labeling and branding
  • Spaces: For organizing visualizations by team or function
  • Aliases and scripted fields: For extending data models

Advanced Kibana Capabilities

As you grow more comfortable with Kibana, explore these powerful features:

Machine Learning Integration

Kibana integrates with Elasticsearch’s machine learning capabilities for:

  • Anomaly detection: Identifying unusual patterns in time-series data
  • Forecasting: Predicting future values based on historical trends
  • Classification: Categorizing data points based on attributes
  • Outlier detection: Finding unusual documents in a dataset
  • Data frame analytics: Running ML algorithms over Elasticsearch data

These features don’t require extensive data science expertise, making advanced analytics accessible to a broader audience.

Kibana Query Language (KQL)

KQL provides a user-friendly alternative to Elasticsearch’s Query DSL:

  • More intuitive syntax for most common queries
  • Auto-completion in the Kibana interface
  • Simplified filtering and field selection
  • Smoother learning curve for non-technical users

Example: response:200 and user.id:kimchy and not source:internal

Observability Features

Recent Kibana versions emphasize observability with:

  • APM: Application performance monitoring
  • Logs: Centralized logging with context
  • Metrics: Infrastructure and service metrics
  • Uptime: Availability monitoring
  • Traces: Distributed tracing visualization

These integrated tools make Kibana a comprehensive observability platform rather than just a visualization tool.

Enterprise Features and Considerations

Organizations deploying Kibana at scale should consider:

Security and Access Control

  • Field-level security: Restricting access to sensitive data fields
  • Document-level security: Filtering results based on user attributes
  • Space-based segregation: Isolating team environments
  • SAML and OIDC integration: Connecting to enterprise identity providers
  • Audit logging: Tracking user actions for compliance

Performance Optimization

  • Index lifecycle management: Automating data retention policies
  • Query optimization: Building efficient visualizations
  • Hardware sizing: Ensuring adequate resources for performance
  • Caching strategies: Improving dashboard load times
  • Rolling indices: Managing time-series data efficiently

Licensing Considerations

  • Open Source vs. Basic vs. Enterprise tiers: Understanding feature differences
  • Support options: Evaluating self-support vs. commercial support
  • Deployment models: On-premises vs. Elastic Cloud
  • Scaling costs: Planning for data growth

The Future of Kibana

Elastic continues to evolve Kibana with each release, focusing on:

  • Enhanced AI integration: More sophisticated machine learning capabilities
  • Improved natural language interfaces: Making data exploration more conversational
  • Deeper observability features: Extending APM and monitoring capabilities
  • Advanced visualization types: Expanding visual analytics options
  • Stronger security analytics: Building on the SIEM foundation

As the volumes of data organizations collect continue to grow, Kibana’s role as the visual interface to this information becomes increasingly vital.

Conclusion

Kibana transforms the powerful but complex capabilities of Elasticsearch into accessible, actionable insights. Whether you’re monitoring system performance, investigating security threats, or analyzing business metrics, Kibana provides the visual tools needed to understand data patterns and make informed decisions.

In an era where data volumes are exploding but attention spans are shrinking, Kibana’s ability to distill complex information into clear visualizations makes it an essential tool for modern data-driven organizations. From DevOps engineers troubleshooting production issues to executives tracking business KPIs, Kibana bridges the gap between raw data and meaningful insights.

As part of the broader Elastic ecosystem, Kibana continues to evolve—adding new visualization types, enhancing machine learning capabilities, and improving user experience. For organizations committed to making data-driven decisions, mastering Kibana is becoming not just advantageous but essential.

Hashtags

#Kibana #Elasticsearch #DataVisualization #ELKStack #LogAnalytics #Dashboards #ObservabilityTools #SIEM #BusinessIntelligence #RealTimeAnalytics #DataExploration #ElasticStack

Leave a Reply

Your email address will not be published. Required fields are marked *