Datadog

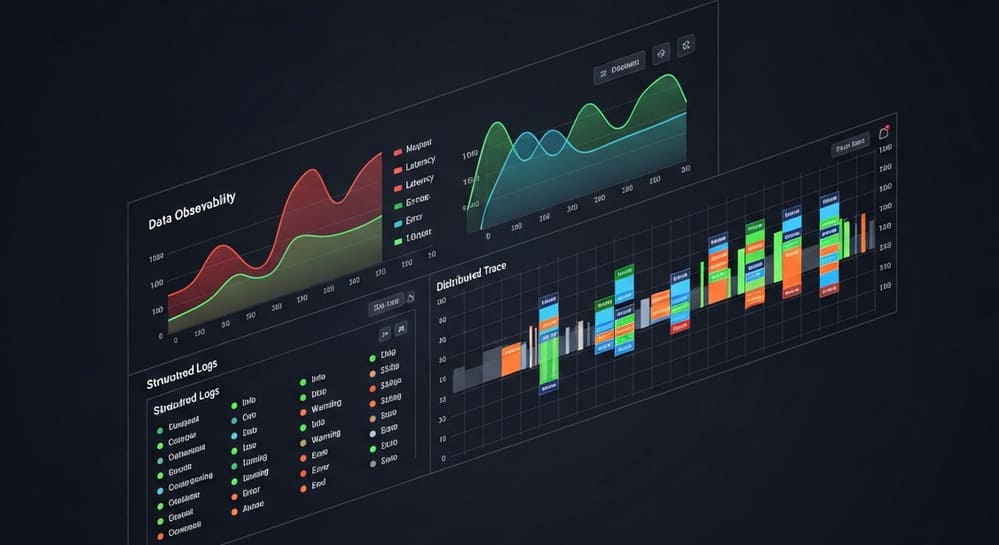
In today’s complex technological landscape, where applications are distributed across multi-cloud environments and microservices architectures, maintaining visibility across your entire stack is more challenging—and more critical—than ever. Enter Datadog, the comprehensive monitoring and analytics platform that has become an essential tool for DevOps teams, data engineers, and SREs worldwide.
Datadog is a cloud-based monitoring and analytics platform that provides full-stack observability for applications, infrastructure, and cloud environments. Founded in 2010 by Olivier Pomel and Alexis Lê-Quôc, former engineers at Wireless Generation, Datadog has grown from a simple infrastructure monitoring tool to a comprehensive observability platform that serves thousands of customers globally, including Samsung, Whole Foods, The Washington Post, and Airbnb.
The platform combines metrics, traces, logs, and more into a unified solution that enables teams to:
- Monitor the performance of applications and infrastructure
- Detect anomalies and troubleshoot issues
- Collaborate effectively during incidents
- Optimize resource usage and performance
- Gain business insights from operational data
Datadog’s infrastructure monitoring forms the foundation of its platform, offering:
- Comprehensive visibility: Monitor servers, containers, cloud services, and network devices from a single dashboard
- Real-time metrics: Track CPU, memory, disk I/O, network performance, and custom metrics
- Automatic discovery: Identify new resources as they spin up in dynamic environments
- Cloud integration: Native support for AWS, Azure, Google Cloud, and other major providers
For data engineers specifically, infrastructure monitoring provides crucial insights into the health and performance of data processing systems, from database servers to Hadoop clusters.
Datadog APM goes beyond infrastructure metrics to provide insights into how your applications are performing:
- Distributed tracing: Follow requests across services and protocols
- Code-level visibility: Identify bottlenecks at the function and query level
- Service maps: Visualize dependencies between components
- Automatic instrumentation: Support for major programming languages and frameworks
When monitoring data pipelines and ETL processes, APM helps identify slow-performing queries or inefficient code that may be creating bottlenecks in your data flow.
Datadog’s log management capabilities allow you to:
- Centralize logs: Collect logs from all applications and infrastructure
- Automatic parsing: Extract structured data from log entries
- Live tail: Search and filter logs in real-time
- Log-to-metric conversion: Generate metrics from log patterns
For data operations, log management is invaluable for troubleshooting failed data jobs, tracking data quality issues, and auditing data access.
Datadog RUM provides visibility into the end-user experience:
- Page load performance: Track how quickly your applications load
- Frontend errors: Catch JavaScript errors affecting users
- User journeys: Follow user paths through your applications
- Core Web Vitals: Monitor Google’s performance metrics
While perhaps less directly applicable to backend data engineering, RUM can help data teams understand how data-driven features impact user experience.
Proactively test your applications with:
- API tests: Verify endpoints are responding correctly
- Browser tests: Simulate user interactions
- Continuous testing: Run tests on schedule or after deployments
- Global coverage: Test from multiple locations worldwide
For data platforms with APIs or user-facing dashboards, synthetic testing ensures that data services remain reliable and performant.
Datadog’s security monitoring helps protect your systems by:
- Detecting threats: Identify security incidents in real-time
- Compliance monitoring: Track compliance with security standards
- Out-of-the-box rules: Apply pre-built detection rules
- Custom security monitoring: Create organization-specific rules
For data engineers, security monitoring is crucial for protecting sensitive data and ensuring compliance with data regulations.
Understand network behavior with:
- Network flow visualization: See traffic patterns across environments
- TCP metrics: Monitor retransmits, latency, and connection tracking
- DNS monitoring: Track resolution times and failures
- Cloud network monitoring: Visualize VPCs and subnets
Network visibility is essential for diagnosing data transfer issues and optimizing data movement between systems.
While Datadog serves various IT functions, it offers specific advantages for data engineering teams:
Datadog provides specialized monitoring for databases including:
- Performance metrics: Query throughput, latency, and resource utilization
- Query analytics: Identify slow queries and optimization opportunities
- Connection pooling: Monitor connection usage and saturation
- Support for major databases: MySQL, PostgreSQL, MongoDB, Redis, Elasticsearch, and more
Example dashboard for a PostgreSQL database might track:
- Query execution time percentiles
- Transaction rates
- Lock contention
- Buffer cache hit ratio
- Replication lag
For teams working with big data technologies, Datadog offers:
- Hadoop monitoring: Track HDFS, YARN, MapReduce metrics
- Spark integration: Monitor executors, job completion, resource usage
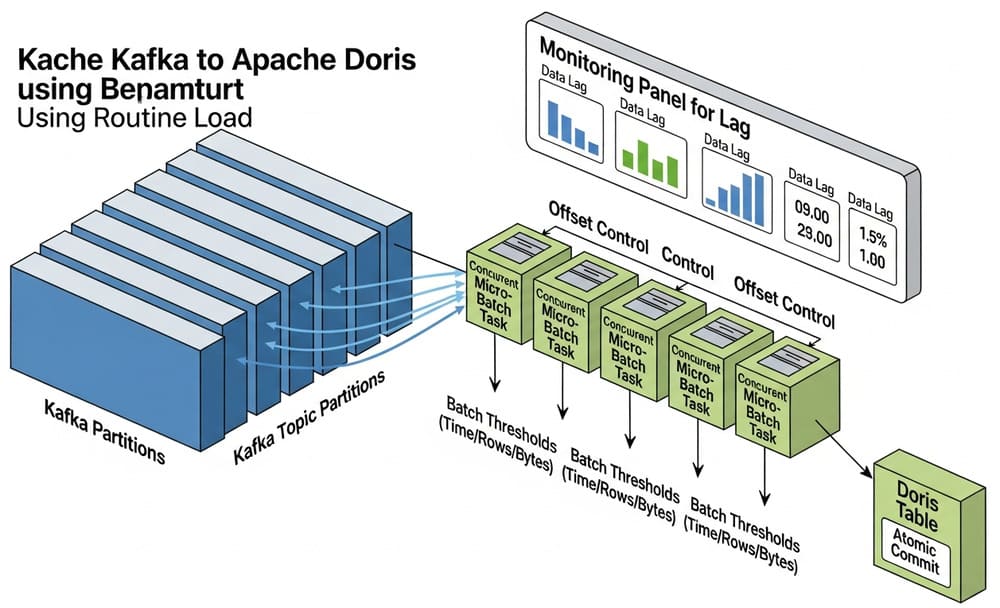
- Kafka visibility: Consumer lag, broker performance, topic throughput
- Flink metrics: Checkpoints, backpressure, throughput
A typical Kafka monitoring setup might include dashboards for:
- Consumer group lag across partitions
- Broker throughput and request rates
- Topic production and consumption rates
- Network throughput
- Under-replicated partitions
For ETL processes and data workflows, Datadog enables:
- Job monitoring: Track completion rates, durations, and failures
- Data freshness: Monitor the age of data across systems
- Lineage integration: Connect with data lineage tools
- Quality metrics: Monitor error rates and validation results
Datadog integrates with common data engineering tools:
- Airflow: Monitor DAG performance and task status
- dbt: Track model build times and failures
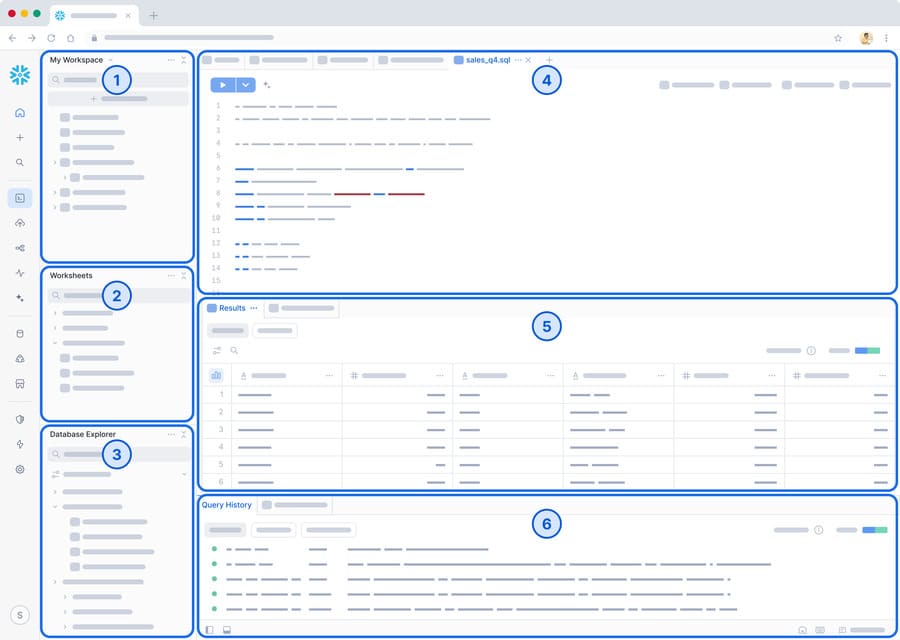
- Snowflake: Analyze query performance and credit usage
- AWS Glue: Monitor ETL job execution
Datadog primarily uses a lightweight agent to collect metrics:
- Install the agent on hosts or containers
- Configure integrations for your technologies
- Automatic collection of metrics and logs
- Cloud-based analysis and visualization
For serverless or cloud-native environments, Datadog also offers agentless monitoring options.
One of Datadog’s most powerful features is its tagging system, which allows for flexible aggregation and filtering:
- Environment tags: dev, staging, production
- Service tags: identify different application components
- Team tags: assign ownership to specific groups
- Custom dimensions: add business context to technical metrics
A well-designed tagging strategy is essential for making sense of complex data infrastructures.
Example tagging for a data pipeline:
env:production
service:user-activity-etl
team:data-engineering
pipeline:user-analytics
data-source:clickstream
Datadog’s monitoring capabilities allow you to:
- Define thresholds: Set conditions for normal operation
- Create anomaly detection: Automatically identify unusual patterns
- Forecast trends: Predict when you’ll hit capacity limits
- Configure alerts: Notify the right people through multiple channels
Common alerts for data engineering might include:
- Pipeline lag exceeding SLAs
- Unusual drop in data volume
- Increase in data quality errors
- Database connection pool saturation
- Disk space nearing capacity on data nodes
Datadog excels at visualization with:
- Custom dashboards: Build views for different stakeholders
- Template variables: Create reusable dashboard templates
- Correlation: Navigate between related metrics, traces, and logs
- Sharing options: Embed views or share snapshots
For data teams, effective dashboards might include:
- Data pipeline health overview
- Database performance metrics
- ETL job success rates
- Data quality metrics
- Infrastructure utilization for data processing
Getting started with Datadog involves:
- Sign up for an account: Start with a free trial
- Install the agent: Deploy on your hosts or containers
- Configure integrations: Enable relevant technology connections
- Set up initial dashboards: Build views for key metrics
- Configure basic alerting: Set up notifications for critical issues
For data engineering, priority integrations often include:
- Database integrations: Connect to your primary datastores
- Message queue monitoring: Kafka, RabbitMQ, or other message brokers
- Processing framework integration: Spark, Flink, or similar
- Orchestration tool connections: Airflow, Prefect, or other workflow systems
- Cloud provider monitoring: AWS, GCP, or Azure services
Best practices for dashboard creation:
- Create role-based views: Different dashboards for operators, engineers, and managers
- Follow a hierarchy: Start with overviews, drill down to details
- Use consistent layouts: Standardize graph types and colors
- Include context: Add text widgets explaining metrics and targets
- Incorporate business metrics: Connect technical metrics to business outcomes
A structured approach to alerts might include:
- Severity levels: Define critical, warning, and informational alerts
- Notification routing: Direct alerts to appropriate teams
- Runbooks: Link alerts to troubleshooting guides
- Alert aggregation: Group related issues to prevent alert fatigue
- Business hours awareness: Adjust urgency based on time of day
Datadog leverages ML for enhanced monitoring:
- Anomaly detection: Identify unusual patterns automatically
- Outlier detection: Find services behaving differently from peers
- Forecasting: Predict metric values based on historical trends
- Pattern recognition: Group similar issues automatically
For data pipelines, these capabilities can detect subtle issues like gradual degradation in processing times or unusual patterns in data volume.
SLOs help maintain reliability by:
- Defining targets: Set clear performance expectations
- Tracking error budgets: Monitor acceptable failure rates
- Visualizing trends: See long-term reliability patterns
- Prioritizing work: Focus on services at risk of missing SLOs
Data engineering SLOs might include:
- Data freshness (how recent is the data?)
- Processing completeness (are all records processed?)
- Query performance (how fast can analysts get results?)
- Pipeline reliability (what percentage of jobs complete successfully?)
Integrate Datadog into your development workflow:
- Deployment tracking: Mark deployments on metric graphs
- Performance regression testing: Compare metrics before and after changes
- Canary deployment monitoring: Track new version performance
- Automated rollbacks: Trigger based on monitoring data
Facilitate team problem-solving with:
- Collaborative notebooks: Combine metrics, logs, and discussion
- Incident management: Coordinate during outages
- Knowledge sharing: Document findings and solutions
- Postmortem creation: Build comprehensive incident reviews
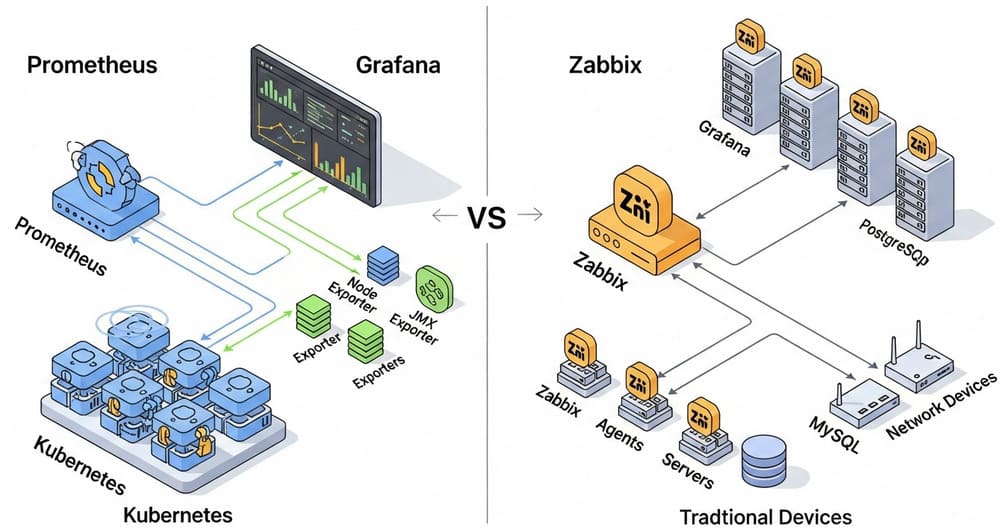
Datadog vs. Prometheus + Grafana:
- Integration breadth: Datadog offers more out-of-box integrations
- Setup complexity: Datadog requires less configuration
- Cost structure: Open-source has lower direct costs but higher maintenance overhead
- Feature completeness: Datadog includes APM, logs, and more in a unified platform
Datadog vs. ELK Stack:
- Focus: ELK specializes in log analysis, Datadog is broader
- Scalability: Both can scale, but with different architectural considerations
- Learning curve: ELK typically requires more specialized knowledge
- Unified view: Datadog offers better integration across metrics, logs, and traces
Datadog vs. New Relic:
- Origin: New Relic started with APM, Datadog with infrastructure
- Pricing model: Different approaches to consumption-based pricing
- UI experience: Subjective differences in dashboard capabilities
- Data retention: Policies differ for metrics, logs, and traces
Datadog vs. Dynatrace:
- AI capabilities: Dynatrace emphasizes its AI-driven approach
- Agent footprint: Different impact on monitored systems
- Enterprise focus: Dynatrace targets larger enterprises
- Automatic discovery: Both offer autodiscovery with different approaches
Datadog pricing is consumption-based, so controlling costs is important:
- Selective metric collection: Focus on what matters
- Sampling high-volume data: Reduce cardinality where appropriate
- Log filtering: Process logs at the source
- Retention policies: Customize storage periods based on need
- Role-based access: Limit user capabilities to control consumption
An e-commerce company used Datadog to:
- Monitor their product recommendation engine
- Track data freshness for inventory updates
- Alert on anomalies in customer behavior data
- Optimize database performance for peak shopping periods
Results included:
- 40% reduction in recommendation engine latency
- 99.9% data pipeline reliability
- Faster troubleshooting during holiday shopping season
A financial services firm implemented Datadog to monitor their data lake:
- Track ingestion rates across hundreds of data sources
- Monitor compliance with data retention policies
- Alert on security anomalies in data access patterns
- Measure query performance for analyst workloads
Outcomes included:
- Identified and resolved data quality issues before business impact
- Reduced mean time to resolution for pipeline failures by 60%
- Improved data analyst satisfaction with platform performance
Use Datadog as part of a DataOps approach:
- Monitoring as code: Define dashboards and alerts in version control
- Automated instrumentation: Include monitoring in data pipeline code
- Feedback loops: Use monitoring to continuously improve processes
- Collaborative workflows: Share insights across data and engineering teams
Watch out for these common issues:
- Alert fatigue: Too many notifications leads to ignored alerts
- Metric explosion: Collecting everything without purpose
- Dashboard sprawl: Creating too many similar views
- Missing context: Technical metrics without business relevance
- Siloed monitoring: Separating application and data monitoring
Important safeguards include:
- Role-based access control: Limit who can see sensitive data
- Audit logging: Track changes to monitoring configuration
- Data filtering: Ensure PII isn’t included in logs or metrics
- Compliance reporting: Use monitoring to demonstrate regulatory adherence
The future of monitoring includes:
- Deeper AI integration: More sophisticated anomaly detection
- Predictive analytics: Forecasting issues before they occur
- Automated remediation: Self-healing based on monitoring data
- Context-aware alerting: Smarter notification systems
Recent Datadog developments point to:
- Security emphasis: Growing focus on security monitoring
- Developer experience: Tools for application developers
- Database monitoring: Expanded capabilities for data stores
- Business metrics: Connecting technical and business insights
Datadog has evolved from a simple infrastructure monitoring tool to a comprehensive observability platform that’s particularly valuable for data engineering teams. By providing unified visibility across metrics, traces, and logs, it enables data engineers to build more reliable, performant, and secure data systems.
The platform’s extensive integration ecosystem, powerful visualization capabilities, and advanced features like anomaly detection and SLOs make it a strong choice for monitoring modern data stacks. While the cost structure requires careful management, the value delivered through improved reliability and faster troubleshooting often justifies the investment.
As data infrastructures continue to grow in complexity, tools like Datadog that provide holistic visibility will become increasingly essential for maintaining reliable data operations.
Whether you’re monitoring real-time data pipelines, data warehouses, or analytics platforms, Datadog offers the capabilities needed to ensure your data systems deliver consistent value to your organization. The key to success lies in thoughtful implementation, following best practices for dashboard design, alert configuration, and metric selection.
By embracing a comprehensive monitoring approach with Datadog, data engineering teams can spend less time firefighting and more time delivering innovative data solutions that drive business value.
#Datadog #Monitoring #DataEngineering #Observability #Analytics #DevOps #DataOps #APM #LogManagement #MetricsMonitoring #DatabaseMonitoring #DataPipelines #CloudMonitoring #SRE #DataInfrastructure #PerformanceMonitoring #RealTimeMonitoring #Alerting #Dashboards #DataVisualization