ELK Stack
In the constantly evolving landscape of data engineering, finding the right tools to collect, process, store, search, and visualize vast quantities of log data is critical for maintaining resilient systems and extracting valuable insights. The ELK Stack—Elasticsearch, Logstash, and Kibana—has emerged as one of the most powerful and widely-adopted open-source solutions for log management and analytics.
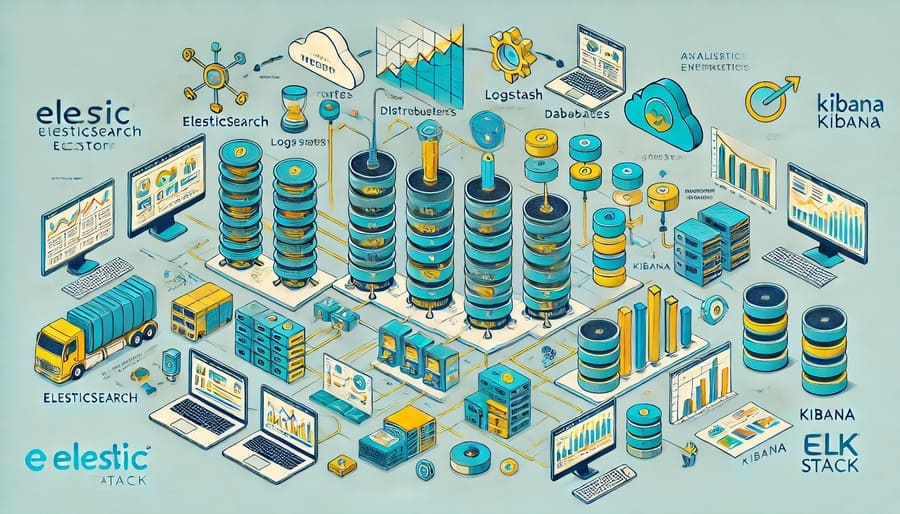
The ELK Stack is a collection of three open-source projects:
- Elasticsearch: A distributed, RESTful search and analytics engine
- Logstash: A data processing pipeline that ingests, transforms, and forwards data
- Kibana: A visualization and exploration tool for Elasticsearch data
Together, these components create a comprehensive platform that can ingest data from virtually any source, in any format, store it efficiently, search through it at remarkable speeds, and visualize it through intuitive dashboards.
Originally developed by Elastic (formerly Elasticsearch B.V.), the ELK Stack has become the backbone of logging infrastructure for organizations ranging from startups to Fortune 500 companies. Its adoption has been so widespread that “ELK” has become synonymous with log management and analysis in many technical circles.
While this article focuses on the core ELK components, it’s worth noting that the platform has evolved to include additional tools:
- Beats: Lightweight data shippers that send data from edge devices to Elasticsearch or Logstash
- X-Pack: Extensions that add features like security, alerting, monitoring, reporting, and machine learning
With these additions, the ecosystem is now often referred to as the “Elastic Stack,” though many practitioners still use the term “ELK Stack” when discussing the core components.
At the heart of the ELK Stack is Elasticsearch, a distributed, RESTful search and analytics engine built on Apache Lucene. Its key characteristics include:
Elasticsearch is designed from the ground up to be distributed:
- Indices are divided into shards: Allows horizontal scaling
- Shards can be replicated: Provides high availability and fault tolerance
- Cluster coordination: Nodes work together seamlessly
- Automatic rebalancing: Optimizes data distribution as the cluster scales
This architecture allows Elasticsearch to scale to handle petabytes of data across hundreds of servers.
Elasticsearch stores data as JSON documents:
- No predefined schema required: Fields can be added on the fly
- Automatic type detection: Elasticsearch infers data types
- Multi-field mapping: The same field can be indexed in multiple ways
- Nested and parent-child relationships: Supports complex document structures
For logging applications, this flexibility is invaluable as log formats can vary widely and evolve over time.
Elasticsearch provides a comprehensive Query Domain Specific Language:
- Full-text search: Find relevant documents based on text content
- Structured queries: Filter by exact field values
- Geo and numerical range queries: Search based on locations or ranges
- Compound queries: Combine multiple query types
- Aggregations: Perform analytics across your data
Example of a complex query to find error logs from a specific application:
{
  "query": {
    "bool": {
      "must": [
        { "match": { "log_level": "ERROR" }},
        { "match": { "application": "payment-service" }}
      ],
      "filter": [
        { "range": { "@timestamp": { "gte": "now-24h" }}}
      ]
    }
  },
  "sort": [
    { "@timestamp": { "order": "desc" }}
  ]
}
Elasticsearch provides near real-time search capabilities:
- Inverted indices: Efficient full-text search
- Doc values: Optimized for aggregations and sorting
- In-memory caching: Boosts frequently accessed data
- Refresh interval: Configurable balance between freshness and performance
For operational logging, this means you can search and analyze log data almost immediately after it’s generated.
Logstash is the data processing component of the ELK Stack, responsible for ingesting, transforming, and shipping data:
Logstash can ingest data from numerous sources:
- Files: Monitor and tail log files
- Syslog: Collect system logs
- Kafka, RabbitMQ: Consume from message queues
- Beats: Ingest from lightweight data shippers
- HTTP endpoints: Receive data via webhooks
- Databases: Pull from relational and NoSQL stores
- AWS, Azure, GCP services: Integrate with cloud platforms
This flexibility makes Logstash capable of centralizing data from your entire infrastructure.
The filter section of Logstash is where data transformation happens:
- Grok: Parse unstructured log data into structured fields
- Mutate: Modify fields (rename, remove, replace, etc.)
- Date: Parse timestamps into standardized formats
- GeoIP: Enrich data with geographical information
- Ruby: Execute custom Ruby code for complex transformations
- JSON: Parse JSON strings into structured data
- Aggregate: Correlate events across a time window
An example Logstash configuration for processing Apache logs:
input {
  file {
    path => "/var/log/apache/access.log"
    start_position => "beginning"
  }
}

filter {
  grok {
    match => { "message" => "%{COMBINEDAPACHELOG}" }
  }
  date {
    match => [ "timestamp", "dd/MMM/yyyy:HH:mm:ss Z" ]
    target => "@timestamp"
  }
  geoip {
    source => "clientip"
  }
  useragent {
    source => "agent"
    target => "user_agent"
  }
}

output {
  elasticsearch {
    hosts => ["elasticsearch:9200"]
    index => "apache-access-%{+YYYY.MM.dd}"
  }
}
Logstash can send processed data to various destinations:
- Elasticsearch: Primary destination in the ELK Stack
- Files: Write to local or networked filesystems
- Message queues: Send to Kafka, RabbitMQ, etc.
- Cloud services: AWS S3, Google Cloud Storage, etc.
- Monitoring tools: Datadog, Nagios, etc.
- Webhooks: Send to HTTP endpoints
This flexibility allows Logstash to fit into complex data architectures and serve multiple use cases simultaneously.
Kibana completes the ELK Stack by providing a user interface for exploring, visualizing, and sharing insights from your data:
Kibana makes Elasticsearch’s search capabilities accessible:
- Lucene query syntax: Advanced search expressions
- Field filters: Quickly filter by field values
- Time range selection: Focus on specific time periods
- Saved searches: Reuse common queries
- Search templates: Create parameterized searches
Kibana offers numerous visualization options:
- Line, area, and bar charts: Visualize trends over time
- Pie and donut charts: Show proportions
- Data tables: Display raw or aggregated data
- Metrics visualizations: Highlight key numbers
- Heat maps: Display density of events
- Coordinate maps: Plot geographical data
- Vega and Vega-Lite: Create custom visualizations
- TSVB (Time Series Visual Builder): Advanced time series analysis
Kibana dashboards combine visualizations for comprehensive views:
- Drag-and-drop layout: Arrange visualizations
- Filtering controls: Add dashboard-wide filters
- Drill-down actions: Navigate from overviews to details
- Time synchronization: All visualizations follow the same time window
- Sharing options: Export, embed, or share dashboards
Beyond basic visualization, Kibana offers:
- Canvas: Create presentation-grade data displays
- Lens: Drag-and-drop visualization builder
- Dashboard drilldowns: Create interactive workflows
- Reporting: Generate PDF reports
- Alerting: Trigger notifications based on data conditions
- Machine Learning: Automatic anomaly detection
Understanding how the components work together is crucial for effective implementation:
The typical flow of data in an ELK deployment:
- Log Generation: Applications and systems generate logs
- Data Collection: Beats or other collectors gather logs
- Data Processing: Logstash enriches and transforms data
- Data Storage: Elasticsearch indexes and stores data
- Data Visualization: Kibana provides user interface for exploration
As your logging needs grow, different scaling patterns emerge:
For small environments:
- Single Elasticsearch node
- Single Logstash instance
- Kibana on the same or separate node
For growing environments:
- Elasticsearch cluster with 3-5 nodes
- Multiple Logstash instances
- Dedicated Kibana server
- Filebeat or other Beats on each source
For enterprise-scale:
- Multi-tier Elasticsearch clusters (hot/warm/cold architecture)
- Logstash processing clusters with load balancing
- Kafka or Redis for buffering
- Multiple Kibana instances behind a load balancer
- Specialized node roles in Elasticsearch
For data engineering teams, the ELK Stack offers specific advantages:
Effective log collection begins with a clear strategy:
- Structured logging: Encourage applications to output structured logs
- Centralized collection: Implement consistent shipping across environments
- Metadata enrichment: Add context like environment, service version, etc.
- Sampling approaches: For very high-volume logs
- Real-time vs. batch processing: Choose based on latency requirements
Transforming raw logs into structured data:
- Common fields: Establish standard fields (timestamp, service, level, etc.)
- Grok pattern libraries: Build reusable parsing patterns
- Field naming conventions: Consistent naming across sources
- Type conversion: Ensure proper data types for analytics
- Error handling: Strategies for malformed logs
Efficient management of Elasticsearch indices:
- Time-based indices: Rotate indices based on time (daily, weekly)
- Index lifecycle policies: Automate retention and archiving
- Rollups: Aggregate historical data for long-term storage
- Aliases: Create views that span multiple indices
- Templates: Define mappings and settings for new indices
Creating dashboards that deliver insights:
- Purpose-specific dashboards: Create different views for different users
- Hierarchical approach: Start with overviews, enable drill-down
- Real-time monitoring: Dashboards for operational visibility
- Historical analysis: Dashboards for trend analysis
- Business metrics: Connect technical logs to business outcomes
The ELK Stack serves numerous data engineering scenarios:
Track application health and performance:
- Error rate monitoring: Track exceptions and failures
- Latency tracking: Monitor response times
- Throughput visualization: Graph request volumes
- Dependency mapping: Understand service relationships
- User journey analysis: Follow user actions through logs
Example dashboard elements:
- Error count by service
- P95 response time trends
- Request volume by API endpoint
- Service dependency heat map
Monitor your infrastructure components:
- Server metrics: CPU, memory, disk, network
- Container insights: Docker, Kubernetes logs and metrics
- Network analysis: Traffic patterns, failures
- Cloud service monitoring: AWS, GCP, Azure service logs
- Security events: Authentication failures, suspicious activity
Gain visibility into data processing workflows:
- Job execution monitoring: Track ETL/ELT job completion
- Data quality metrics: Monitor validation results
- Pipeline latency: Measure end-to-end processing time
- Volume tracking: Monitor data throughput
- Failure analysis: Identify and diagnose failed processes
Example Logstash configuration for data pipeline monitoring:
filter {
  if [type] == "pipeline_event" {
    json {
      source => "message"
    }
    date {
      match => ["timestamp", "ISO8601"]
      target => "@timestamp"
    }
    mutate {
      add_field => {
        "pipeline_duration_ms" => "%{[end_time]}"
      }
    }
    ruby {
      code => "
        begin
          start_time = Time.parse(event.get('start_time'))
          end_time = Time.parse(event.get('end_time'))
          duration = ((end_time - start_time) * 1000).to_i
          event.set('pipeline_duration_ms', duration)
        rescue => e
          event.set('ruby_exception', e.message)
        end
      "
    }
  }
}
Monitor and analyze security-related data:
- Authentication monitoring: Track login attempts
- Access pattern analysis: Identify unusual behaviors
- Compliance auditing: Record access to sensitive data
- Threat hunting: Search for indicators of compromise
- Security incident investigation: Forensic analysis of events
Tuning the ELK Stack for optimal performance:
- Hardware considerations: SSD storage, adequate memory, CPU cores
- JVM tuning: Heap size, garbage collection settings
- Indexing optimization: Bulk sizes, refresh intervals, shard sizing
- Query optimization: Use filters over queries when possible
- Caching strategies: Fielddata, query, request cache settings
- Worker configuration: Match to available CPU cores
- Batch sizing: Balance throughput and latency
- Persistent queues: Prevent data loss during outages
- Pipeline tuning: Optimize filter complexity
- Plugin selection: Choose efficient plugins
Securing your ELK deployment:
- Authentication options: Basic auth, LDAP, Active Directory, SSO
- Authorization controls: Role-based access control
- Network security: TLS/SSL encryption, network segregation
- Audit logging: Track system access and changes
- Data security: Field-level security, document-level security
Ensuring resilience and reliability:
- Elasticsearch clustering: Proper replication and shard allocation
- Logstash redundancy: Multiple instances with load balancing
- Queue buffering: Kafka or Redis to handle traffic spikes
- Cross-cluster replication: Geographic distribution
- Disaster recovery: Snapshot and restore procedures
Keeping your logging platform healthy:
- Stack monitoring: Use X-Pack monitoring or metricbeat
- Alerting: Set up notifications for cluster health issues
- Capacity planning: Track growth and plan expansions
- Performance benchmarking: Establish baselines for normal operation
- Log rotation: Manage ELK’s own logs
Understanding where ELK fits in the logging ecosystem:
Comparison with proprietary solutions:
- Splunk: More out-of-the-box features but significantly higher cost
- Sumo Logic: SaaS convenience vs. ELK’s flexibility
- Datadog Logs: Integrated with broader monitoring vs. ELK’s logging focus
- New Relic Logs: Application-centric approach vs. ELK’s broader use cases
Comparison with open-source competitors:
- Graylog: Stronger security focus vs. ELK’s broader analytics capabilities
- Loki: Lower resource requirements vs. ELK’s richer query language
- Fluentd + Elasticsearch + Grafana: Similar capabilities with different components
- TICK Stack: Time-series focus vs. ELK’s full-text search strengths
Looking ahead at where the platform is going:
Recent developments and future trends:
- Observability focus: Unifying logs, metrics, and traces
- Machine learning: Automated anomaly detection and forecasting
- Security expansion: SIEM and endpoint security capabilities
- Cloud services: Managed Elasticsearch Service across providers
- Kubernetes integration: Native support for container ecosystems
The broader ecosystem around ELK:
- Plugin ecosystem: Community-developed extensions
- Integration partnerships: Pre-built connectors to other tools
- Knowledge sharing: Active forums and contributor communities
- Enterprise adoption: Growing use in large organizations
- Open source challenges: Licensing changes and community response
The ELK Stack represents one of the most powerful and flexible solutions for log management and analysis in the data engineering space. Its combination of robust search capabilities, flexible data processing, and intuitive visualization tools makes it suitable for organizations of all sizes, from startups to enterprises.
What sets ELK apart is its adaptability—it can be deployed in various architectures to meet different requirements, scale from a single server to massive clusters, and handle virtually any type of log data from any source. This flexibility, combined with its open-source nature, has driven widespread adoption across industries.
For data engineering teams, the ELK Stack offers a comprehensive solution for gaining visibility into applications, infrastructure, and data pipelines. By implementing effective logging practices and leveraging the full capabilities of Elasticsearch, Logstash, and Kibana, teams can improve troubleshooting efficiency, detect issues proactively, and extract valuable insights from their operational data.
As the platform continues to evolve, adding capabilities like machine learning, security features, and tighter integration with cloud-native technologies, its value proposition for data-driven organizations only grows stronger. Whether you’re just starting with centralized logging or looking to enhance an existing implementation, the ELK Stack provides a powerful foundation for your observability strategy.
#ELKStack #Elasticsearch #Logstash #Kibana #LoggingAndAnalytics #DataEngineering #Observability #LogManagement #OpenSource #BigData #SearchAnalytics #DataVisualization #Monitoring #DevOps #SRE #CloudNative #DataPipelines #LogAggregation #ElasticStack #Beats #DataObservability