Graylog
In today’s complex IT and data engineering environments, managing logs effectively isn’t just a good practice—it’s essential for troubleshooting, security, compliance, and gaining operational insights. Among the various log management solutions available, Graylog has emerged as a powerful contender, particularly appealing to organizations looking for a robust open-source platform that scales with their needs.
Graylog is an open-source log management platform designed to collect, index, analyze, and visualize log data from various sources across your infrastructure. Built to handle massive volumes of data, Graylog provides a centralized system for managing logs from applications, servers, network devices, and virtually any component that generates log data.
Originally created in 2009 by Lennart Koopmann, Graylog has evolved from a simple log collector into a comprehensive log management solution with both open-source and enterprise offerings. Today, it’s trusted by thousands of organizations worldwide, from startups to large enterprises.
Understanding Graylog’s architecture helps appreciate its capabilities and design considerations:
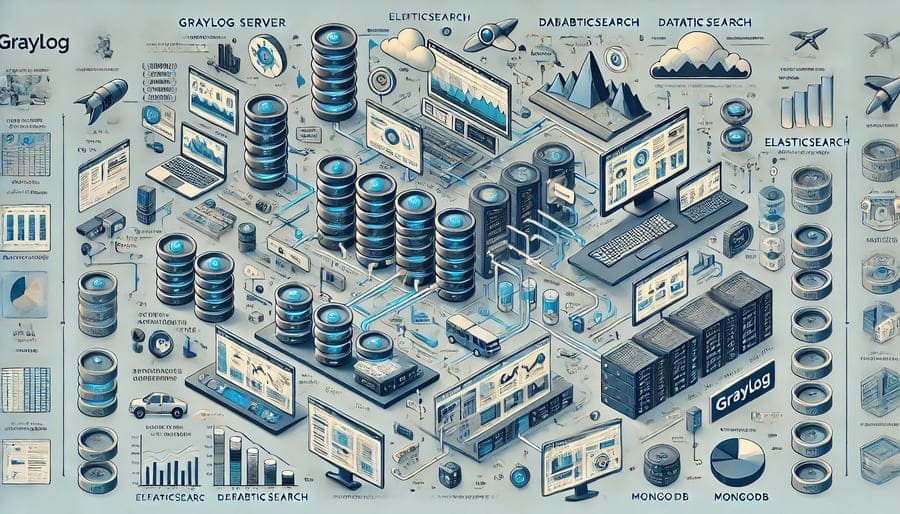
Graylog consists of several key components that work together:
- Graylog Server: The central application that processes incoming log messages, coordinates searches, and manages the web interface
- Elasticsearch: The search and analytics engine that stores and indexes log data
- MongoDB: Stores configuration and metadata about users, dashboards, streams, and other system settings
- Input System: Various connectors that accept data from different sources
- Web Interface: A user-friendly frontend for searching, visualizing, and managing logs
The typical flow of data in a Graylog deployment:
- Collection: Log data is sent to Graylog inputs from various sources
- Processing: The server processes and enriches the incoming data
- Indexing: Processed messages are stored in Elasticsearch for efficient searching
- Analysis: Users search, analyze, and visualize the data through the web interface
- Alerting: Notifications are triggered based on predefined conditions
- Forwarding: Optionally, data can be routed to other systems
Graylog excels at ingesting data from diverse sources:
- Syslog: Native support for the standard logging protocol used by many systems
- GELF (Graylog Extended Log Format): Graylog’s optimized logging format that supports compression and chunking
- Beats: Lightweight data shippers from the Elastic ecosystem
- Log files: Direct ingestion from text-based log files
- Windows Event Log: Native support for Windows logging
- JSON over HTTP/TCP/UDP: Modern application logging formats
- AWS CloudWatch: Cloud service logging
- Custom inputs: Extensible input system for specialized sources
Once data arrives, Graylog provides extensive processing capabilities:
- Message filtering: Focus on relevant data
- Field extraction: Parse unstructured logs into structured fields
- Enrichment: Add context with lookups from external sources
- Normalization: Standardize formats from different systems
- Transformation: Modify content to meet specific requirements
- Routing: Direct messages to different streams based on content
- Processing pipelines: Create sophisticated processing workflows
Example: A pipeline rule that extracts fields from a custom log format:
rule "Extract fields from application log"
when
    has_field("message") AND
    contains(to_string($message.message), "TransactionComplete")
then
    let parts = split(regex("TransactionComplete: ID=([A-Z0-9]+) Amount=(\d+\.\d+) Status=(\w+)", to_string($message.message)), ",");
    set_field("transaction_id", parts[0]);
    set_field("amount", to_double(parts[1]));
    set_field("status", parts[2]);
end
Graylog provides powerful search capabilities:
- Full-text search: Find relevant log entries quickly
- Field-based queries: Search structured data with precision
- Boolean operators: Create complex search conditions
- Saved searches: Reuse common queries
- Search syntax highlighting: Improve readability of search terms
- Relative and absolute time ranges: Focus on specific periods
- Search within results: Progressively refine searches
Example query to find failed login attempts:
action:login AND result:failure AND source_ip:192.168.* AND NOT user:system
Convert log data into actionable insights:
- Widgets: Various visualization types (charts, graphs, tables)
- Custom dashboards: Create role-specific views
- Drill-down capabilities: Navigate from overviews to details
- Real-time updates: See data as it arrives
- Export options: Share findings with stakeholders
- Dashboard parameters: Create dynamic, reusable dashboards
Stay informed about important events:
- Threshold-based alerts: Trigger on numerical conditions
- Absence alerting: Notify when expected events don’t occur
- Aggregation alerts: Trigger based on patterns across multiple messages
- Multiple notification channels: Email, Slack, PagerDuty, HTTP endpoints, and more
- Alert conditions: Flexible definition of what constitutes an alert
- Scheduled searches: Run queries on a schedule and alert on results
Enterprise-grade security features:
- Role-based access control: Define who can access what data
- Authentication integration: LDAP, Active Directory, OAuth
- TLS/SSL support: Secure communications
- Audit logging: Track user actions
- Data retention policies: Control how long data is kept
- Content packs: Share configurations securely
For data engineering teams, Graylog offers specific advantages and use cases:
Track the health and performance of your data workflows:
- Job execution logs: Monitor ETL/ELT processes
- Data validation results: Track quality checks
- Pipeline latency: Measure processing times
- Error tracking: Identify and diagnose failures
- Data volume monitoring: Track throughput and detect anomalies
Example dashboard elements for a data pipeline:
- Success/failure counts by job
- Processing time trends
- Error rate by data source
- Volume processed per hour
- Validation failure types
Gain visibility into your data infrastructure:
- Database logs: Monitor query performance, errors, and access patterns
- Replication status: Track data synchronization
- Connection monitoring: Identify connection issues
- Storage metrics: Monitor capacity and growth
- Authentication events: Track access and security
Extract business insights directly from logs:
- User behavior analysis: Track how users interact with data systems
- Data access patterns: Understand which datasets are most valuable
- Performance analytics: Identify bottlenecks and optimization opportunities
- Usage reporting: Generate reports on system utilization
- Trend analysis: Identify patterns over time
Graylog offers flexible deployment models:
- Open-source: Free, community-supported version
- Enterprise: Commercial version with additional features
- Cloud: Managed service option
- Containers: Docker and Kubernetes support
- Virtual appliances: Pre-configured images for quick deployment
Proper sizing ensures optimal performance:
- Message volume: How many logs per second?
- Retention period: How long to keep data?
- Search load: How intensive are the searches?
- Number of users: How many people will access the system?
- High availability requirements: What level of redundancy is needed?
A simplified deployment process:
- Set up prerequisites: Install MongoDB and Elasticsearch
- Install Graylog server: Deploy the central component
- Configure inputs: Set up data collection
- Create streams: Organize incoming messages
- Configure indices: Set up storage and retention
- Set up users: Configure access control
- Deploy collectors: Install agents on log sources
Connect Graylog with your data engineering ecosystem:
- Data processing frameworks: Capture logs from Spark, Flink, etc.
- Orchestration tools: Monitor Airflow, Luigi, or custom schedulers
- Data warehouses: Track query performance and errors
- Streaming platforms: Monitor Kafka, Pulsar, or other messaging systems
- Analytics engines: Capture usage and performance data
Example configuration for monitoring Apache Spark applications:
inputs:
  - type: beats
    port: 5044
    bind_address: 0.0.0.0
    recv_buffer_size: 1048576

processors:
  - name: Spark Log Parser
    script: |
      let app_id = regex_match("app_\\d+_\\d+", to_string($message.log_file_path));
      if (app_id) {
        set_field("spark_app_id", app_id);
      }
      if (contains(to_string($message.message), "Exception")) {
        set_field("log_level", "ERROR");
        set_field("has_exception", true);
      }
A financial services company implemented Graylog to monitor their data processing platform:
Challenges:
- Complex ETL processes handling sensitive customer data
- Strict regulatory compliance requirements
- Need for early detection of data quality issues
Graylog Implementation:
- Centralized logging from over 200 data processing nodes
- Custom extractors for proprietary formats
- Compliance dashboards for auditors
- Alert integration with incident management
Results:
- 40% reduction in troubleshooting time
- Complete audit trail for compliance
- Early detection of data anomalies
- Improved visibility across teams
An e-commerce platform used Graylog to improve their analytics workflow:
Challenges:
- Real-time processing of customer behavior data
- Multiple data sources with inconsistent formats
- Need to track data lineage for marketing analysis
Graylog Implementation:
- GELF integration with custom applications
- Processing pipeline for standardizing formats
- Dashboards for data quality metrics
- Alerts for processing delays
Results:
- Identified and resolved bottlenecks in data processing
- Improved data quality through early detection of issues
- Better collaboration between data and marketing teams
- Comprehensive visibility across the analytics pipeline
Graylog and ELK (Elasticsearch, Logstash, Kibana) have some overlapping capabilities:
- Architecture: Both use Elasticsearch for storage, but Graylog adds MongoDB for configuration
- User Interface: Graylog provides a more specialized interface for log management, while Kibana offers broader visualization options
- Setup complexity: Graylog is generally simpler to deploy as a cohesive unit
- Focus: Graylog is purpose-built for logs, while ELK serves broader analytics use cases
Comparing the open-source leader to the commercial giant:
- Cost: Graylog offers significant cost advantages, especially at scale
- Enterprise features: Splunk provides more out-of-the-box integrations and advanced features
- Learning curve: Graylog interface may be more intuitive for log-specific tasks
- Ecosystem: Splunk has a larger marketplace of apps and integrations
How Graylog differs from these popular log collectors:
- Scope: Fluentd/Fluent Bit are primarily collectors, while Graylog is a complete platform
- Storage: Graylog includes storage and indexing, Fluentd requires external storage
- UI: Graylog provides a rich interface, Fluentd has no native UI
- Complementary use: Many organizations use Fluentd to collect logs for Graylog
Strategies for handling massive log volumes:
- Horizontal scaling: Add more Graylog and Elasticsearch nodes
- Clustering: Distribute processing across multiple servers
- Load balancing: Distribute incoming messages
- Optimized inputs: Use efficient protocols like GELF
- Strategic indexing: Balance index size and search performance
- Message filtering: Process only what you need
Ensuring your log management meets requirements:
- Data classification: Identify sensitive information in logs
- Field anonymization: Protect PII and sensitive data
- Audit trails: Track who accessed what data
- Immutable storage: Prevent tampering with log data
- Retention policies: Keep data as required by regulations
- Access controls: Implement least privilege principles
Ensuring resilient log management:
- Multi-node clusters: Eliminate single points of failure
- Load balancer: Distribute client connections
- Elasticsearch replication: Ensure data redundancy
- MongoDB replication: Protect configuration data
- Geographical distribution: Protect against site failures
- Backup strategies: Regular snapshots and offsite storage
Keeping your Graylog deployment running smoothly:
- Hardware considerations: Adequate CPU, RAM, and fast storage
- Index optimization: Proper sharding and replication
- Message processing tuning: Efficient pipeline rules
- Search performance: Optimize queries and field indexing
- Caching strategies: Leverage Elasticsearch caching
- Resource monitoring: Watch system performance metrics
The platform continues to evolve:
- Graylog 4.x: Improved UI, simplified configuration, enhanced search
- Illumination: Advanced correlation and context features
- Graylog Operations: Extended monitoring capabilities
- Enhanced security features: SIEM-like functionality
- Improved API: Better programmatic access
Where the industry is heading:
- Machine learning: Automated anomaly detection
- Log-based observability: Unifying logs, metrics, and traces
- Real-time analytics: Faster insights from log data
- Compliance automation: Simplified regulatory reporting
- Cloud-native focus: Better support for ephemeral infrastructure
For data engineering teams, effective log management is not just about troubleshooting—it’s a critical component of maintaining reliable, secure, and compliant data systems. Graylog provides a powerful, flexible platform that scales from basic centralized logging to sophisticated log analytics and monitoring.
What sets Graylog apart is its balance of power and usability. It offers the robust features needed for enterprise environments while remaining approachable for smaller teams. The open-source foundation provides cost advantages and flexibility, while the enterprise offerings add the security, scalability, and support that larger organizations require.
Whether you’re tracking data pipeline failures, monitoring database performance, ensuring compliance, or extracting business insights from operational data, Graylog offers the tools to transform your log data from a troubleshooting necessity into a valuable asset for your data engineering practice.
By implementing Graylog as part of your data engineering tool chain, you can improve system reliability, accelerate problem resolution, enhance security posture, and gain deeper insights into how your data systems operate—all critical capabilities in today’s data-driven world.
#Graylog #LogManagement #DataEngineering #Observability #LogAnalytics #OpenSource #DataPipelines #Monitoring #SecurityAnalytics #Compliance #DataObservability #LogCollection #Elasticsearch #ETLMonitoring #RealTimeAnalytics #DevOps #DataOps #SIEM #DatabaseMonitoring #OperationalIntelligence