Kibana in 2026: The Complete Guide to Elasticsearch Visualization and Analytics
Introduction
You have logs. Millions of them. Application logs, security events, metrics, user behavior data. They’re all flowing into Elasticsearch. Now you need to make sense of them.
This is where Kibana comes in.
Kibana is the visualization and exploration layer for the Elastic Stack. It turns raw data in Elasticsearch into dashboards, charts, and insights. Security teams use it to hunt threats. DevOps teams use it to monitor systems. Business analysts use it to explore user behavior.
But Kibana is more than just charts. It’s a complete analytics platform with machine learning, alerting, and specialized applications for logs, metrics, APM, and security.
This guide covers everything you need to know about Kibana. You’ll learn what it does well, where it struggles, how it compares to alternatives, and how to use it effectively.
What is Kibana?
Kibana is the frontend for Elasticsearch. It was created in 2011 as a simple log analysis tool. Over time, it evolved into a full analytics platform.
The core idea is simple. Elasticsearch stores and indexes your data. Kibana lets you search, visualize, and analyze it. You don’t write code. You build queries, create visualizations, and assemble dashboards through a web interface.
Kibana is part of the Elastic Stack, which includes Elasticsearch for storage and search, Logstash and Beats for data collection, and various other tools. Most people still call it the ELK Stack (Elasticsearch, Logstash, Kibana).
Core Capabilities
Discover: Data Exploration
Discover is where you explore your data. It’s like a powerful search interface combined with a spreadsheet view of your documents.
You can search across all your indices. Filter by time range. Add field filters. Build complex queries using KQL (Kibana Query Language) or Lucene syntax. Save your searches for later.
The interface shows matching documents with all their fields. You can expand documents to see the full JSON structure. Sort by any field. Add or remove columns. Export results.
Where it shines: Quickly finding specific events or patterns in large datasets. Troubleshooting issues by searching logs. Initial data exploration before building visualizations.
Limitations: Not great for analyzing millions of documents at once. The UI can feel sluggish with very large result sets. Advanced aggregations require visualization tools.
Visualize: Building Charts
The Visualize section lets you create charts from your Elasticsearch data. You pick a visualization type, connect it to an index, and configure the metrics and buckets.
Kibana supports standard chart types like line graphs, bar charts, pie charts, and data tables. It also has specialized visualizations like heat maps, tag clouds, and coordinate maps.
You build visualizations by defining aggregations. Metrics define what to calculate (count, sum, average, percentile). Buckets define how to group the data (by time, by field value, by range).
Where it shines: Creating visualizations without writing code. Quick iteration on chart designs. Support for Elasticsearch aggregations.
Limitations: Can feel clunky compared to modern BI tools. Limited interactivity in charts. Some visualization types are outdated. Complex visualizations require understanding Elasticsearch aggregations.
Dashboards: Bringing It Together
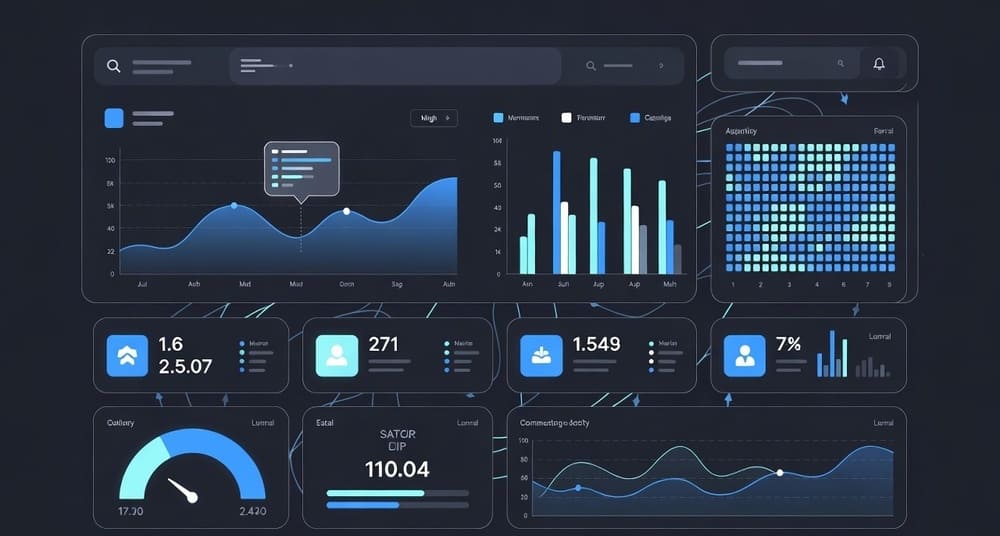
Dashboards combine multiple visualizations into a single view. You arrange panels, set time ranges, add filters, and share with your team.
Dashboards update in real time as data flows into Elasticsearch. You can drill down from high-level metrics to specific events. Apply filters that affect all panels. Set refresh intervals.
Kibana includes dashboard features like variables, drill-downs, and URL parameters. You can embed dashboards in other applications. Export them as PDFs. Set up scheduled reports.
Where it shines: Operational dashboards that update continuously. Combining different data views in one place. Sharing analysis with non-technical users.
Limitations: Limited layout options compared to modern tools. Performance can degrade with many panels. Dashboard organization gets messy at scale.
Canvas: Pixel-Perfect Reports
Canvas is Kibana’s presentation layer. It lets you create custom layouts with precise control over design and formatting.
You work on a blank canvas. Add elements like images, text, shapes, and data visualizations. Position them exactly where you want. Apply styling and formatting. Build multi-page workbooks.
Canvas uses its own expression language for data queries and transformations. It’s more powerful than standard visualizations but has a steeper learning curve.
Where it shines: Executive reports and presentations. Branded dashboards for clients. Infographics and custom layouts.
Limitations: Takes longer to build than standard dashboards. Expression language requires learning. Not suitable for quick analysis.
Lens: Modern Visualization Builder
Lens is Kibana’s answer to criticism about visualization complexity. It launched in version 7.5 and keeps getting better.
Lens uses a drag-and-drop interface. You drag fields onto the canvas. Kibana suggests appropriate visualization types. You can switch between chart types with one click. The interface is more intuitive than the classic Visualize app.
Behind the scenes, Lens still uses Elasticsearch aggregations. But it abstracts away the complexity. You think about what you want to show, not how to build the aggregation.
Where it shines: Fast visualization creation. Lower learning curve for new users. Exploring data without knowing Elasticsearch aggregations.
Limitations: Less control than classic visualizations. Some advanced features not available. Still evolving with each release.
Specialized Applications
Kibana includes purpose-built applications for specific use cases. These go beyond generic visualization into domain-specific workflows.
Logs: Application Log Analysis
The Logs app is designed for analyzing application and system logs. It replaces the need to build custom log dashboards.
You get a stream view of logs with intelligent parsing. Search and filter by any field. Jump to surrounding logs for context. View log rates over time. Categorize logs with machine learning.
The app integrates with Elastic Common Schema (ECS) for standardized field names. If your logs follow ECS, many features work automatically.
Where it shines: Centralized log analysis. Troubleshooting application issues. Monitoring log patterns and anomalies.
Limitations: Requires proper log parsing. Best with ECS-formatted logs. Learning curve for complex filtering.
Metrics: Infrastructure Monitoring
The Metrics app monitors infrastructure health. It shows host metrics, container metrics, and Kubernetes metrics.
You see a visual inventory of your infrastructure. Click any host to see detailed metrics. CPU, memory, disk, network. Set up alerts for threshold violations. Compare metrics across hosts.
The app works with Metricbeat and other Beats collectors. It understands common metric patterns and presents them logically.
Where it shines: Infrastructure monitoring without custom dashboards. Quick drill-down from overview to details. Integration with alerting.
Limitations: Less flexible than custom dashboards. Focused on infrastructure metrics. Not suitable for business metrics.
APM: Application Performance Monitoring
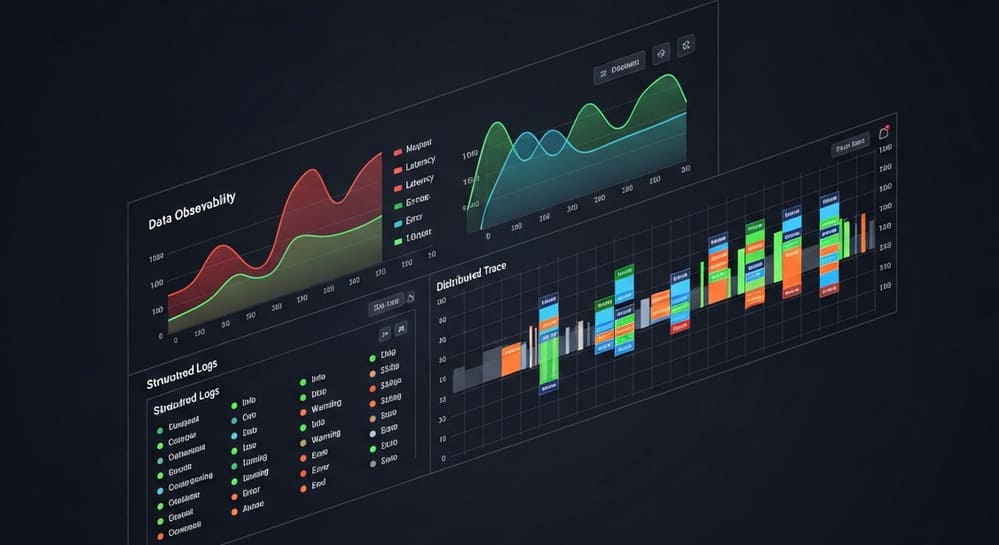
APM tracks application performance using distributed tracing. You instrument your applications with APM agents. They send traces to Elasticsearch. Kibana visualizes them.
You see service maps showing dependencies. Trace individual requests across microservices. Identify bottlenecks and errors. Correlate APM data with logs and metrics.
APM supports many languages including Java, Python, Node.js, Go, Ruby, and .NET. The agents are relatively easy to integrate.
Where it shines: Distributed tracing in microservices. Finding performance bottlenecks. Correlating errors with traces and logs.
Limitations: Requires application instrumentation. Can generate significant data volume. Some languages better supported than others.
Security: SIEM and Security Analytics
Elastic Security (formerly SIEM) provides security monitoring, threat detection, and incident response capabilities.
You get security dashboards out of the box. Detection rules for common threats. Timeline analysis for investigations. Host and network visibility. Integration with threat intelligence feeds.
The security app includes Elastic Endpoint Security for endpoint protection. Detection rules use ECS and can detect attacks like privilege escalation, lateral movement, and data exfiltration.
Where it shines: Security monitoring without building from scratch. Pre-built detection rules. Integration of logs, metrics, and endpoint data.
Limitations: Requires security expertise to use effectively. Detection rules need tuning. Can generate alert fatigue without proper configuration.
Machine Learning
Kibana includes machine learning features for anomaly detection and forecasting. These run in Elasticsearch but you configure them through Kibana.
Anomaly detection finds unusual patterns in your data. It learns normal behavior and alerts on deviations. You can detect anomalies in metrics, log patterns, or any time series data.
Forecasting predicts future values based on historical trends. Useful for capacity planning and trend analysis.
Where it shines: Finding issues you didn’t know to look for. Reducing manual threshold setting. Forecasting resource needs.
Limitations: Requires Platinum or Enterprise license. Learning curve for configuration. Can produce false positives without tuning.
Alerting and Actions
Kibana’s alerting system monitors conditions and triggers actions. You define rules based on thresholds, queries, or ML anomalies. When rules trigger, Kibana executes actions.
Actions include sending emails, posting to Slack, creating Jira tickets, calling webhooks, or triggering PagerDuty incidents. You can chain multiple actions together.
Alerts integrate across Kibana apps. Set alerts on metrics, logs, APM data, or security events. Manage all alerts from a central interface.
Where it shines: Flexible alert conditions. Integration with external systems. Unified alerting across data types.
Limitations: Can be complex to set up. Alert management gets unwieldy at scale. Some actions require paid connectors.
Data Ingestion: Getting Data Into Kibana
Kibana visualizes data in Elasticsearch. So you need to get data there first. The Elastic Stack provides several tools.
Beats: Lightweight Data Shippers
Beats are lightweight agents for collecting and shipping data. Each Beat focuses on a specific data type.
Filebeat ships log files. Metricbeat ships system and application metrics. Packetbeat ships network data. Auditbeat ships audit data. Heartbeat monitors uptime. Functionbeat runs on serverless platforms.
Beats are easy to deploy. Configure a YAML file. Point it at Elasticsearch. The Beat handles the rest. Many include modules for common systems like Apache, MySQL, Redis, and AWS services.
When to use Beats: Collecting logs and metrics from servers. Standard data types with good module support. Lightweight deployment without complex processing.
Logstash: Data Processing Pipeline
Logstash is a data processing pipeline. It ingests data from multiple sources, transforms it, and ships it to Elasticsearch.
Logstash has three stages: inputs, filters, and outputs. Inputs collect data from files, syslog, databases, message queues, and APIs. Filters parse, enrich, and transform data. Outputs send data to Elasticsearch or other destinations.
The filter stage is powerful. Parse unstructured logs with grok patterns. Enrich data with GeoIP lookups. Add fields, remove fields, rename fields. Join data from multiple sources.
When to use Logstash: Complex data transformation requirements. Ingesting from sources without Beat modules. Enriching data before indexing. Multiple output destinations.
Elastic Agent: Unified Agent
Elastic Agent is the newer unified agent. It combines functionality of multiple Beats into a single agent managed through Kibana.
You configure Elastic Agent through Fleet in Kibana. Deploy agents to hosts. Manage configurations centrally. Roll out updates. The agent handles logs, metrics, and security data.
Fleet management makes it easier to manage agents at scale. You define policies in Kibana and apply them to agent groups.
When to use Elastic Agent: Centralized management requirements. New deployments. Organizations standardizing on Elastic Stack. Simplified agent deployment.
Direct Indexing
You can also send data directly to Elasticsearch from applications. Use Elasticsearch client libraries for various programming languages.
This works well for application-generated events, custom metrics, or data from systems you control.
When to use direct indexing: Application instrumentation. Custom data sources. Real-time data from services you control.
Index Patterns and Data Views
Before you visualize data in Kibana, you need to tell Kibana which Elasticsearch indices to query. You do this with index patterns (now called data views).
An index pattern matches one or more Elasticsearch indices. You might have an index pattern for logs, another for metrics, another for APM data.
Kibana reads the field mappings from matched indices. It understands field types and shows appropriate visualization options. Date fields enable time-based analysis. Keyword fields work for filtering and grouping. Numeric fields work for calculations.
You can have multiple index patterns. Switch between them when creating visualizations. Apply different time fields and field formatters.
Best practices:
- Use index patterns that match logically related indices
- Keep index naming consistent for easier pattern matching
- Set the correct time field for time-based analysis
- Use field formatters for better readability
- Refresh field lists when you change mappings
Query Languages: KQL and Lucene
Kibana supports two query languages. KQL (Kibana Query Language) is the default. Lucene syntax is available for advanced users.
KQL (Kibana Query Language)
KQL is designed to be simple and safe. It uses straightforward syntax for common queries.
Field equals value: status:200 Field exists: user.email:* Boolean logic: status:200 and method:GET Wildcards: user.name:john* Ranges: bytes > 1000 and bytes < 5000
KQL doesn’t support regex or complex query string syntax. This makes it safer for non-technical users but less powerful for advanced queries.
Lucene Query Syntax
Lucene syntax is more powerful but more complex. It supports regex, fuzzy matching, proximity searches, and field boosting.
Regex: user.name:/joh?n/ Fuzzy: username:johm~ Proximity: "quick brown fox"~10 Boosting: urgent^2 important
Most users stick with KQL. Switch to Lucene when you need advanced features.
Performance Considerations
Kibana’s performance depends heavily on Elasticsearch. Slow queries in Elasticsearch mean slow visualizations in Kibana.
Query Performance
Large time ranges slow down queries. Aggregating millions of documents takes time. Complex visualizations with many sub-aggregations multiply the work.
Optimization strategies:
- Use smaller time ranges when possible
- Limit the number of buckets in aggregations
- Avoid visualizations with excessive sub-aggregations
- Use sampling for exploratory analysis
- Consider rollup indices for long-term trends
Dashboard Performance
Dashboards with many panels can slow down. Each panel runs a separate query. Ten panels mean ten queries.
Optimization strategies:
- Limit panels per dashboard (aim for under 15)
- Use dashboard refresh intervals wisely
- Cache queries where possible
- Split large dashboards into multiple focused ones
- Use Canvas for complex layouts that need fewer queries
Index Performance
How you index data affects query speed. Proper field mappings, appropriate shard counts, and index lifecycle management all matter.
Optimization strategies:
- Use appropriate field types in mappings
- Don’t over-shard (aim for 10-50GB per shard)
- Implement index lifecycle policies
- Use data streams for time-series data
- Consider frozen or cold tiers for old data
Common Use Cases
Log Analysis and Troubleshooting
This is where Kibana started. Centralize logs from all your applications and infrastructure. Search them when issues occur. Build dashboards to monitor error rates and patterns.
Set up the Logs app with proper log parsing. Use the Discover interface for ad-hoc searches. Create visualizations for common patterns. Set alerts for error spikes.
Infrastructure and Application Monitoring
Monitor system health, application performance, and user experience. Collect metrics with Metricbeat and APM agents. Visualize in the Metrics and APM apps.
Build dashboards showing key performance indicators. Set up alerts for threshold violations. Correlate metrics with logs when investigating issues.
Security Monitoring and SIEM
Detect security threats, investigate incidents, and maintain compliance. Collect security logs, network traffic, and endpoint data. Use Elastic Security for analysis and response.
Enable built-in detection rules or write custom ones. Investigate incidents in the Timeline interface. Track threats with case management features.
Business Analytics
Analyze user behavior, track conversions, monitor business metrics. Send application events to Elasticsearch. Build dashboards tracking key metrics.
Kibana works for business analytics but lacks features compared to dedicated BI tools. It’s best for technical analytics tied to operational data.
IoT and Sensor Data
Collect data from IoT devices and sensors. Index in Elasticsearch. Visualize trends, detect anomalies, and monitor device health.
Time series visualization features handle sensor data well. Machine learning can detect abnormal readings. Alerting can notify when devices malfunction.
Kibana vs. Alternatives
Kibana vs. Grafana
Grafana is the most common Kibana alternative. Both visualize time-series data, but they have different strengths.
Grafana strengths:
- Better visualization quality and customization
- Support for many data sources beyond Elasticsearch
- More active development and modern UI
- Better alerting capabilities
- Strong Prometheus integration
Kibana strengths:
- Deeper Elasticsearch integration
- Log analysis features
- Full-text search capabilities
- APM and security applications
- Machine learning features
Many teams use both. Kibana for logs and security. Grafana for metrics and mixed-source dashboards.
Kibana vs. Splunk
Splunk is the enterprise log management and SIEM platform. It’s more expensive but more mature in some areas.
Splunk strengths:
- More mature SIEM features
- Better compliance reporting
- Stronger enterprise support
- More extensive third-party integrations
- Simpler pricing model
Kibana strengths:
- Open source and more affordable
- Modern architecture and performance
- Better for high-volume scenarios
- More flexible deployment options
- Growing rapidly in features
Teams choosing between them often consider cost, existing infrastructure, and specific feature needs.
Kibana vs. Datadog
Datadog is a commercial monitoring platform with logs, metrics, traces, and more. It’s fully managed with no infrastructure to maintain.
Datadog strengths:
- Fully managed (no infrastructure)
- Unified platform with consistent UX
- Strong integrations with cloud platforms
- Better alerting and incident management
- Mobile apps for monitoring on the go
Kibana strengths:
- Self-hosted option with data control
- More affordable at very high scale
- Better for custom use cases
- Deeper query capabilities
- Open source flexibility
Datadog wins on ease of use. Kibana wins on cost at scale and flexibility.
Kibana vs. Tableau/Power BI
Tableau and Power BI are dedicated BI tools. They’re better for business intelligence but worse for operational monitoring.
BI tool strengths:
- Superior visualization quality
- Better interactive exploration
- Easier for non-technical users
- More data transformation capabilities
- Better presentation features
Kibana strengths:
- Real-time data updates
- Full-text search capabilities
- Better for log and event data
- Integrated with operational tools
- Lower latency for fresh data
Use BI tools for business reporting. Use Kibana for operational analytics and monitoring.
Best Practices
Index Management
Good index management makes Kibana faster and more reliable.
Use index templates to ensure consistent mappings. Implement index lifecycle policies to manage retention. Use data streams for time-series data. Shard appropriately based on data volume. Consider hot/warm/cold architecture for cost optimization.
Dashboard Design
Build dashboards that load quickly and communicate clearly.
Limit panels to what’s essential. Use appropriate visualization types for your data. Set reasonable time ranges by default. Add helpful descriptions and labels. Organize related dashboards into spaces. Use variables for flexible filtering.
Access Control
Control who sees what data and dashboards.
Use Kibana Spaces to separate different teams or projects. Configure role-based access control. Limit access to sensitive indices. Share dashboards appropriately. Audit access and changes.
Monitoring and Maintenance
Keep Kibana healthy and performant.
Monitor Kibana and Elasticsearch health. Set up alerts for system issues. Review slow queries and optimize. Clean up unused dashboards and visualizations. Keep Kibana and Elasticsearch versions synchronized.
Version Control
Treat Kibana configurations as code.
Export dashboards and visualizations. Store them in version control. Use CI/CD for deploying changes. Document dashboard purposes and owners. Track changes over time.
Common Pitfalls
Overloading dashboards. Too many panels slow everything down. Split into multiple focused dashboards instead.
Ignoring time ranges. Querying years of data for every dashboard refresh kills performance. Use appropriate defaults and refresh intervals.
Poor field mappings. Elasticsearch needs correct field types for good visualization. Text fields can’t be aggregated efficiently. Use keyword for filtering and grouping.
Forgetting about users. Building dashboards for yourself is easy. Building them for others requires thinking about what they need and understand.
Not considering data volume. What works with gigabytes breaks with terabytes. Plan for growth in your architecture and queries.
Ignoring security. Don’t expose sensitive data through open dashboards. Use access controls and audit access.
Over-engineering. Start simple. Add complexity only when needed. Many use cases work with basic visualizations.
The Future of Kibana
Elastic continues investing heavily in Kibana. Several trends are shaping its evolution.
Lens is becoming the default. The modern visualization builder is replacing older tools. Expect more features and better performance in Lens.
Serverless Elasticsearch. Elastic is moving toward serverless offerings. This changes how you think about infrastructure and scaling.
AI integration. Natural language queries, automated insights, and AI-assisted analysis are coming. The question isn’t if but when and how well.
Better enterprise features. Reporting, alerting, and collaboration features keep improving. Kibana is becoming more suitable for enterprise analytics.
Unified observability. Logs, metrics, traces, and user experience data are converging into single workflows. Kibana is the interface for this unified view.
Cloud-first development. New features often launch in Elastic Cloud first. Self-hosted deployments get them later.
Key Takeaways
Kibana is the visualization and analytics layer for Elasticsearch. It turns raw data into insights through dashboards, apps, and machine learning.
It excels at log analysis, infrastructure monitoring, and security analytics. The tight integration with Elasticsearch enables powerful queries and real-time analysis.
Specialized apps for logs, metrics, APM, and security provide purpose-built workflows. You don’t need to build everything from scratch.
Performance depends on query design and Elasticsearch optimization. Large time ranges and complex aggregations slow things down.
Kibana works best for operational analytics tied to Elasticsearch data. For pure business intelligence, dedicated BI tools may be better.
The platform keeps evolving. Lens makes visualization easier. Machine learning finds anomalies automatically. Unified observability brings everything together.
If you’re already using Elasticsearch, Kibana is the natural choice for visualization. If you’re starting fresh, consider whether the Elastic Stack fits your overall architecture and use cases.
Tags: Kibana, Elasticsearch, ELK Stack, Elastic Stack, data visualization, log analysis, infrastructure monitoring, APM, SIEM, security analytics, observability, time series data, dashboard creation, Grafana alternative, operational analytics, machine learning, anomaly detection, Logstash, Beats, metrics monitoring

