What Is the ELK Stack (Elastic Stack) and Why Should Data Engineers Care?
The ELK Stack = Elasticsearch + Logstash + Kibana:
- Elasticsearch – distributed search & analytics engine that stores and indexes data. (Wikipedia)
- Logstash – data processing pipeline that ingests, transforms, and ships data. (FOSS TechNix)
- Kibana – visualization & dashboard layer on top of Elasticsearch. (Wikipedia)
In practice, people also add Beats (Filebeat, Metricbeat, etc.), so you’ll often see “Elastic Stack” instead of just “ELK”. (Elastic)
For a data engineer, ELK is basically a real-time log warehouse:
- Centralizes logs from microservices, containers, databases, load balancers, etc. (GeeksforGeeks)
- Turns unstructured text into queryable, filterable events.
- Feeds observability, security analytics, and ad-hoc troubleshooting.
If you work with distributed systems, streaming, or modern data platforms, ELK is one of the main tools that tells you if your system is actually alive.
ELK Stack Architecture for Logging & Observability
Think of ELK as a ETL pipeline dedicated to logs:
- Data Shippers (Beats / app loggers)
- Agents like Filebeat tail log files or read from journald, Docker logs, etc., and send events to Logstash or directly to Elasticsearch. (FOSS TechNix)
- Logstash – the Transform Layer
- Ingests events from many sources (TCP, HTTP, Kafka, Beats…).
- Applies filters (grok parsing, JSON decode, geoip, mutate, date, etc.).
- Outputs to Elasticsearch (or S3, Kafka, etc., if you fan-out). (Syskool)
- Elasticsearch – the Storage & Query Engine
- Stores events in indices (often time-based:
logs-YYYY.MM.DD). - Uses distributed shards and replicas for horizontal scale and HA. (Wikipedia)
- Supports full-text search + aggregations → super fast log queries.
- Stores events in indices (often time-based:
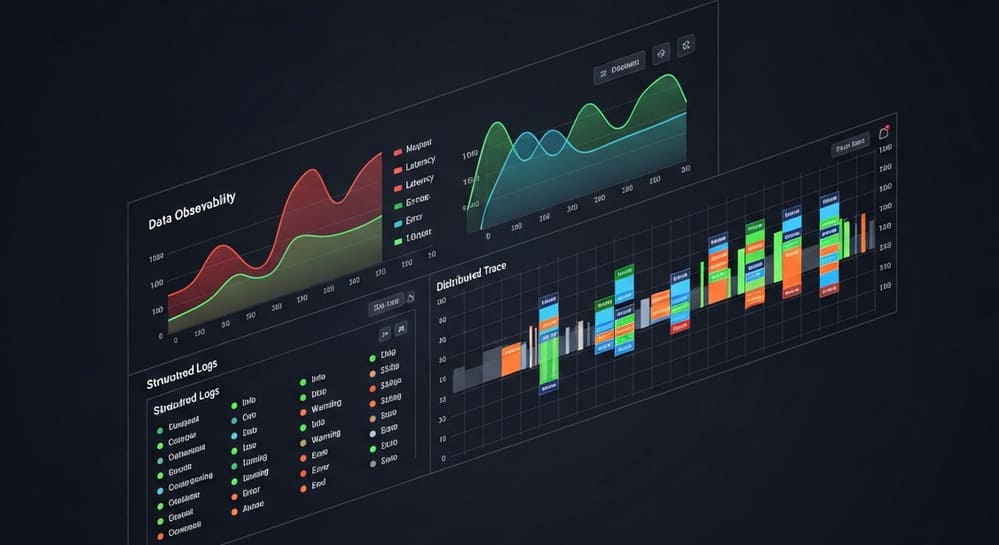
- Kibana – the Analytics & Visualization UI
- Discover view for ad-hoc queries.
- Dashboards for SRE / security / product teams.
- Alerting, Lens, and Observability/SIEM views in newer versions. (Wikipedia)
Mental Model
If a modern data warehouse stack is:
(Fivetran) → dbt → Snowflake → Looker
then an ELK logging stack feels like:
Beats → Logstash → Elasticsearch → Kibana
Same pattern, just optimized for high-volume, semi-structured log events instead of relational data.
Example: Centralized Logging for Microservices
Imagine:
- 40+ microservices running on Kubernetes.
- Each writes logs to STDOUT.
- You need to answer:
“Why did latency spike in EU region between 10:01–10:04?”
High-Level Flow
- Filebeat / Fluent Bit on each node
- Tails container logs, adds metadata (pod, namespace, node).
- Logstash as central pipeline
# /etc/logstash/conf.d/kube-logs.conf
input {
  beats {
    port => 5044
  }
}

filter {
  # Parse JSON logs
  json {
    source => "message"
  }

  # Extract fields
  mutate {
    rename => { "[kubernetes][pod_name]" => "pod" }
    convert => { "latency_ms" => "integer" }
  }

  # Parse timestamps
  date {
    match => ["timestamp", "ISO8601"]
    target => "@timestamp"
  }
}

output {
  elasticsearch {
    hosts => ["https://es-logs.internal:9200"]
    index => "k8s-logs-%{+YYYY.MM.dd}"
  }
}
- Elasticsearch stores time-based indices
- Daily indices (
k8s-logs-2025.11.26) for easier rollover & retention. latency_ms,service,region,status_codeas structured fields.
- Kibana dashboards
- Latency heatmap per service & region.
- Error-rate dashboard by HTTP status & route.
- Saved searches: “5xx in last 10 minutes”, “login failures”.
Now instead of SSH-ing into random pods, you just:
- Open Kibana → filter
service:payment AND region:eu-west-1 AND status_code:500.
Practical Configuration Tips (from a Data Engineer’s Angle)
1. Index Design & Sharding
Bad index strategy = cluster death.
- Use time-based indices for logs (daily or hourly for huge volume). (GeeksforGeeks)
- Avoid “index per customer per day” – shard explosion. Better:
- Shared index with
customer_idfield + filtered aliases.
- Shared index with
- Start with 1–3 primary shards per index, adjust via benchmarks.
- Use ILM (Index Lifecycle Management):
- Hot → Warm → Cold → Delete or move to S3.
2. Mapping & Field Types
If you let Elasticsearch auto-guess everything, it will:
- Create a ton of
text+keyworddual fields. - Blow up heap & disk due to high cardinality.
Better:
- Explicit index templates for known log types.
- Disable indexing for junk fields (stack traces, huge payloads).
- Use
keywordfor IDs, enums, service names. - Use
date,integer,float,booleanwhere appropriate.
3. Logstash Pipeline Design
Common anti-pattern: one giant Logstash pipeline doing everything.
- Split by concern:
input_kafka.conffilter_app_logs.conffilter_nginx.confoutput_es.conf
- Use multiple pipelines if you have radically different log sources.
- Offload heavy transformations to upstream (app or Kafka stream) where possible.
4. Security & Multi-Tenancy
ELK by default was historically not multi-tenant friendly; you must design it. (arXiv)
- Enable TLS and auth on Elasticsearch and Kibana. (Markaicode)
- Use roles & index patterns:
- Team A →
logs-team-a-* - Team B →
logs-team-b-*
- Team A →
- For strict isolation: separate clusters or namespaces per environment (prod vs non-prod).
5. Resource Management
Elasticsearch is memory-hungry.
- Keep JVM heap around 50% of RAM, max ~30–32 GB (compressed oops limit).
- Prefer more smaller nodes over a few massive ones.
- Monitor:
- Heap usage
- GC time
- Query latency
- Indexing throughput
- Disk I/O
Common Pitfalls When Using ELK in Real Systems
1. “Let’s just log everything forever”
Result:
Cluster melts, disks explode, queries crawl.
Mitigation:
- Define log retention policies per index type (7, 30, 90, 365 days).
- Downsample older data (daily rollups).
- Archive raw logs to S3/Glacier if you must keep them for compliance.
2. Unbounded Cardinality Fields
Putting user_id, request_id, stacktrace, URL query params into analyzed text fields:
- Destroys index size & performance.
- Makes aggregations useless.
Mitigation:
- Only aggregate on low/medium cardinality fields (service, route, region).
- Store high-cardinality fields as:
keywordwithdoc_values: false(no aggregations), orindex: false(just stored).
3. Treating ELK as a General Data Warehouse
ELK is amazing for logs, metrics, and event streams – not a replacement for Snowflake/BigQuery.
- Use ELK for:
- Troubleshooting & observability.
- Security events, audit logs.
- Short- to mid-term operational analytics.
- Use your warehouse/lakehouse for:
- Long-term history.
- Heavy joins, complex analytics, ML feature pipelines.
4. Over-complicated Grok & Parsing
Logstash grok filters with 15 nested regexes:
- Kill CPU.
- Are brittle when log formats change.
Mitigation:
- Prefer structured JSON logs from apps.
- Keep grok patterns simple & versioned.
- Add tests for your grok patterns with sample logs.
How ELK Fits into a Modern Data Platform
As a data engineer, you can think of ELK as:
- Real-time operational store for logs & metrics.
- Source system feeding:
- Kafka topics (via Logstash or Elasticsearch → connector).
- S3/GCS (for batch ETL into warehouse).
- Sidecar to your main data platform:
- Snowflake/Databricks/BigQuery for BI & ML.
- ELK for “what’s happening right now?”
Typical pattern:
- Apps → (JSON logs) → Beats → Logstash → Elasticsearch (hot data, 7–30 days).
- Elasticsearch snapshots / Logstash outputs → S3.
- S3 → warehouse via external tables or ingestion jobs for long-term analytics.
Best Practices Checklist for ELK in Production
- Use structured logs (JSON) from services.
- Standardize fields:
@timestamp,level,service,env,trace_id. - Implement index templates and ILM from day 1.
- Keep shards per node reasonable (rule of thumb: <20–30 active shards/GB heap; benchmark).
- Protect cluster with TLS, auth, and role-based access.
- Separate prod vs non-prod clusters.
- Monitor ES/Kibana/Logstash health with dedicated dashboards.
- Decide early what not to index (big payloads, PII, very noisy fields).
Conclusion & Takeaways
If you’re a data engineer, the ELK Stack is:
- Your real-time microscope on distributed systems.
- A specialized log warehouse optimized for search and aggregations.
- A critical input to both observability and security analytics.
Key ideas to keep in your head:
- Treat ELK as an observability engine, not a general DWH.
- Design indices, mappings, and retention like you’d design tables and partitions.
- Push structure as early as possible (at the app or Logstash layer).
- Watch cardinality, shard counts, and retention or your cluster will punish you.
If you can read a production incident dashboard in Kibana and tie it back to your data pipelines and systems, you’re a lot closer to being the “senior” in “Senior Data Engineer.”
Image Prompt (for DALL·E / Midjourney)
“A clean, modern observability architecture diagram showing the ELK Stack: logs flowing from microservices into Beats, then Logstash, then a distributed Elasticsearch cluster, with Kibana dashboards on top — minimalistic, high-contrast, 3D isometric style, dark background, neon accent lines.”
Tags / Keywords
#ELKStack #Elasticsearch #Logstash #Kibana #Observability #Logging #Monitoring #DataEngineering #DevOps #SRE
ELK Stack, Elasticsearch, Logstash, Kibana, Observability, Logging, Monitoring, Data Engineering, DevOps, SRE


