Prometheus vs Zabbix for Data Platforms: How to Choose Your Monitoring Stack
If your data platform goes down at 3 a.m., you only care about two things:
“Who’s broken?” and “How fast can I prove it?”
Prometheus and Zabbix can both answer those questions — but they do it in very different ways. Pick the wrong one for your platform and you’ll either drown in operational overhead or hit a wall when you try to scale.
This guide is the blunt, data-engineer-focused comparison you wish product pages gave you.
1. Why Prometheus vs Zabbix Matters for a Data Platform
Modern data platforms aren’t just a couple of ETL jobs and a warehouse anymore. You’re monitoring:
- Orchestrators (Airflow, Dagster, Prefect)
- Compute (Kubernetes, EMR, Spark clusters, Databricks jobs)
- Storage (S3/GCS/Azure Blob, HDFS, object storage gateways)
- Databases / engines (Snowflake, Postgres, ClickHouse, Kafka, Redshift, etc.)
- SLAs/SLOs (late data, failed DAGs, row-count anomalies)
You need a monitoring stack that:
- Speaks “metrics-first” (latency, throughput, error rates, queue depth, lag)
- Scales with ephemeral/cloud-native workloads
- Is not a full-time job to babysit
Prometheus shines in cloud-native metric collection and flexible querying.(Prometheus)
Zabbix shines as a traditional, all-in-one infrastructure monitoring suite with agents, templates, and a built-in UI.(Zabbix)
For a data platform, the trade-offs are very real. Let’s break them down.
2. Architectural Overview (Without Marketing Fluff)
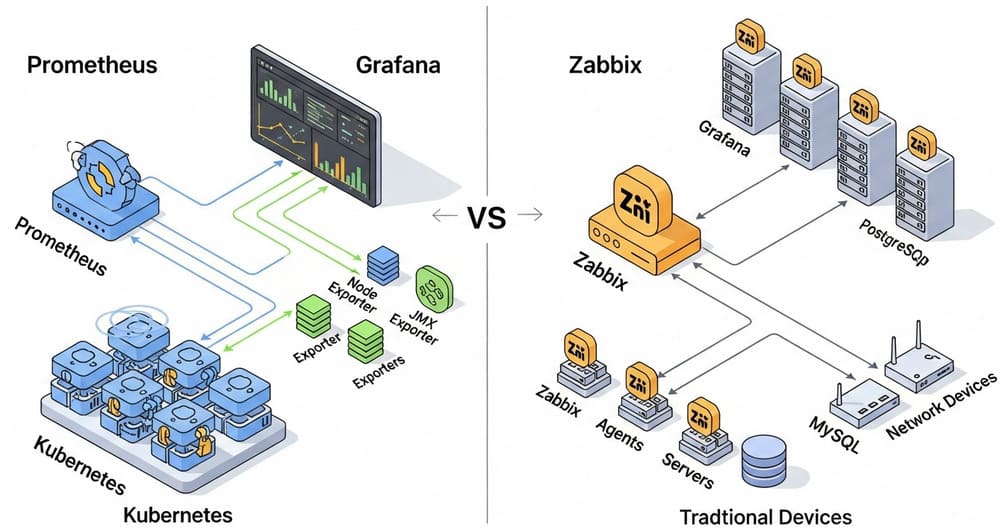
2.1 Prometheus in One Picture
Prometheus is a time-series database + metrics collector with a pull-based model:
- Prometheus server
- Scrapes metrics over HTTP from targets (“exporters”) at intervals.(DevOpsCube)
- Stores metrics in its own on-disk time-series DB (TSDB).(devopsvoyager.hashnode.dev)
- Exporters
- Small services exposing
/metrics(e.g.,node_exporter,kube-state-metrics, Kafka exporters).(network-insight.net)
- Small services exposing
- PromQL
- Query language for aggregations, rates, joins across time series.(Prometheus)
- Alertmanager
- Handles alert routing, dedup, silencing; integrates with Slack, PagerDuty, email, etc.(Prometheus)
- Usually paired with Grafana for dashboards.(DeepWiki)
Key mental model:
Prometheus = “pull metrics from anything with an HTTP endpoint, label them, then slice and dice with PromQL.”
2.2 Zabbix in One Picture
Zabbix is an integrated monitoring platform with agents, server, DB, and UI.(Zabbix)
Core pieces:
- Zabbix server
- Central brain; stores configuration and metrics in an external DB (MySQL, Postgres, etc.).(Zabbix)
- Zabbix agents
- Installed on hosts; collect metrics and send them to the server. Support active and passive checks.(Zabbix)
- Proxies
- Optional middle layer for distributed / remote sites.(Zabbix)
- Frontend
- Built-in web UI for dashboards, triggers, maps, SLA views.(Zabbix)
Key mental model:
Zabbix = “central server + database + agents + UI for monitoring mostly host- and service-level metrics in a very structured way.”
3. The One Difference That Changes Everything: Pull vs Push
Prometheus: Pull model with labels
Prometheus pulls metrics by scraping /metrics endpoints:
# prometheus.yml snippet
scrape_configs:
  - job_name: "airflow"
    metrics_path: /admin/metrics
    static_configs:
      - targets:
          - "airflow-webserver:8080"
          - "airflow-scheduler:8793"
        labels:
          env: "prod"
          component: "orchestrator"
You just make your service expose metrics, register the endpoint, and Prometheus does the rest. Great for:
- Kubernetes pods / services
- Microservices
- Exporters for Kafka, Redis, PostgreSQL, Spark, etc.
You can still push via the Pushgateway for batch jobs, but that’s a workaround.(GitHub)
Zabbix: Agent/server with active + passive checks
Zabbix focuses on agents:
- Passive check: server asks agent for metric → agent returns value.(Zabbix)
- Active check: agent pulls item list from server and pushes metrics back.
Typical Zabbix item definition (simplified UI concept):
- Key:
system.cpu.load[percpu,avg1] - Interval:
60s - Trigger:
last(/host/system.cpu.load[percpu,avg1])>5
Great for:
- Static fleets (VMs, bare metal, appliances)
- Network gear, Windows servers, on-prem legacy
For ephemeral containers scaling up/down constantly, Prometheus feels natural; Zabbix can do it, but it’s not designed around Kubernetes as a first-class citizen.
4. What a Data Engineer Actually Cares About
4.1 Metric-first vs Host-first Thinking
Prometheus is metric-first:
- “
airflow_dag_run_duration_secondsp95 by dag_id, env” - “
spark_job_failed_totalby cluster and app_id” - “
kafka_consumer_lagby consumer_group, topic, partition”
You model business and pipeline SLIs as metrics and then query them flexibly.
Zabbix is host-first:
- “Host
etl-prod-01CPU > 90%” - “Host
db-01disk utilization > 80%” - “Service X down on Windows node Y”
You can do app-level and business metrics, but it’s less natural; you’re working inside item keys, templates, and triggers.
For a serious data platform, you’ll eventually want metric-first thinking (SLIs, SLOs, RED/USE methods). That leans Prometheus.
4.2 Example: “Alert me when a DAG is silently dying”
Prometheus approach
Instrument your job runner:
from prometheus_client import Counter, start_http_server

FAILED_JOBS = Counter(
    "data_job_failed_total",
    "Number of failed data jobs",
    ["job_name", "env"]
)

if __name__ == "__main__":
    start_http_server(8000)  # exposes /metrics
    try:
        run_job()
    except Exception:
        FAILED_JOBS.labels(job_name="daily_orders_etl", env="prod").inc()
        raise
Prometheus rule:
groups:
  - name: data-jobs-alerts
    rules:
      - alert: DataJobFailuresHigh
        expr: increase(data_job_failed_total{env="prod"}[15m]) > 3
        for: 10m
        labels:
          severity: critical
        annotations:
          summary: "Data job failures spike in prod"
          description: "More than 3 failures in 15m (check DAGs, infra)."
That’s very close to how you think as a data engineer.
Zabbix approach
You’d typically:
- Send job status to Zabbix (via sender, trapper item, or custom script).(DediRock)
- Define an item like
job.daily_orders_etl.failed - Create a trigger expression that fires when value changes or exceeds a threshold.
Doable, but more ceremony; you’re bending a host-based system into business-metric space.
5. Comparison Table: Prometheus vs Zabbix for Data Platforms
| Dimension | Prometheus | Zabbix |
|---|---|---|
| Core model | Time-series DB + pull-based metric scraping | Server + agents + DB + built-in UI |
| Primary focus | Cloud-native, microservices, metrics | Traditional infra, servers, network devices |
| Querying | PromQL (very powerful, label-based)(Prometheus) | Trigger expressions, simple trend functions(Zabbix) |
| Storage | Embedded TSDB, short–medium retention; remote storage options(devopsvoyager.hashnode.dev) | External DB (MySQL/Postgres/etc.) for all data(Zabbix) |
| Dashboards | Usually Grafana (excellent for time-series)(DeepWiki) | Built-in UI with graphs, maps, SLA views(syone.com) |
| Ephemeral workloads (K8s, Spark) | Natural fit with service discovery, labels | Possible but heavier to manage |
| Infra / network monitoring | Good with exporters; not as turnkey | Very strong templates for OS, network gear, apps(Zabbix) |
| Alerting | Alertmanager, label-based routing, silence | Built-in actions, escalations, SLA reporting(syone.com) |
| Learning curve | PromQL & cardinality pitfalls | Zabbix concepts (items, triggers, templates, proxies) |
| Ops overhead | Need to own scaling/federation/retention strategy(DEV Community) | Need to operate DB, server, and agents at scale(Zabbix) |
6. Best Practices and Common Pitfalls
6.1 Prometheus: Do’s and Don’ts for Data Teams
Best practices
- Treat metrics as a first-class contract
- Define a small, stable set of metrics per service (
*_duration_seconds,*_total,*_in_progress).
- Define a small, stable set of metrics per service (
- Watch cardinality like a hawk
- Avoid labels like
user_id,query_text,job_run_id. They will blow up memory and disk.(DEV Community)
- Avoid labels like
- Use recording rules for derived metrics
- Precompute heavy PromQL expressions (e.g.
rate(...)[5m]) to keep dashboards fast.
- Precompute heavy PromQL expressions (e.g.
- Decide retention explicitly
- Short retention (e.g. 15–30 days) in Prometheus; long-term in remote storage (Thanos, Cortex, Mimir, etc.).(devopsvoyager.hashnode.dev)
- Standardize dashboards
- For each pipeline: latency, throughput, error rate, backlog, and infra metrics.
Pitfalls
- Treating Prometheus as a long-term analytics warehouse. It isn’t.
- Letting each team define metrics in their own random style → chaos.
- Ignoring Alertmanager; hard-coding notification logic in tools instead of using labels and routing.
6.2 Zabbix: Do’s and Don’ts for Data Teams
Best practices
- Leverage templates for standard infra (Linux, Windows, DBs, network devices).(Zabbix)
- Use proxies for remote networks / DMZs instead of punching weird firewall holes.(Zabbix)
- Separate DB from app server and tune cache sizes, history, trends for scale.(syone.com)
- Map hosts to logical groups:
data-platform/db,data-platform/etl,data-platform/kafka.
Pitfalls
- Overloading a single Zabbix server + DB with everything in the company → pain.
- Using the built-in DB with poor tuning; housekeeper jobs destroying performance.(syone.com)
- Trying to turn Zabbix into a full-blown observability platform for complex app-level SLIs — it can, but it’s not the path of least resistance.
7. So What Should You Choose?
Let’s be direct.
Choose Prometheus (with Grafana) if:
- Your data platform is Kubernetes-heavy, microservice-heavy, or cloud-native.
- You care about SLIs/SLOs for pipelines: “p99 latency of ingestion”, “Snowflake query failure rate”, “Kafka consumer lag”.
- Teams are comfortable writing queries (SQL, PromQL, etc.).
- You’re okay owning some operational complexity around scaling Prometheus/federation.
This is the typical stack:
Prometheus + Alertmanager + Grafana
(+ exporters for Kafka, Postgres, Kubernetes, Spark, etc.)
Choose Zabbix if:
- You have a large traditional infrastructure footprint: VMs, physical servers, on-prem DBs, network devices.
- You want an all-in-one monitoring product (UI, alerts, SLA, maps) with less integration work.
- Your team prefers config via UI/templates rather than writing queries.
- You want strong host and network monitoring for your data platform’s underlying infra.
Hybrid (honestly, this is what many larger orgs end up with):
- Prometheus for app / data-platform metrics (pipelines, services, SLOs).
- Zabbix for infra, network, legacy systems.
You don’t get bonus points for religiously picking one tool. You get points for being able to prove SLA compliance and debug incidents fast.
8. Internal Link Ideas (for Your Blog / Documentation)
You can link this article to:
- “How to Design SLIs for Data Pipelines (Latency, Freshness, Accuracy)”
- “Prometheus Metrics You Should Add to Every Data Service”
- “Grafana Dashboards for Airflow, Spark, and Kafka: A Practical Guide”
- “Zabbix Templates for Data Infrastructure: DBs, Storage, and Network”
- “Building a Hybrid Observability Stack: Prometheus + Zabbix + Logs”
These make a nice monitoring/observability cluster around this core comparison article.
9. Conclusion & Key Takeaways
If you’re building or owning a data platform, monitoring is not “an ops problem.” It’s part of your data engineering architecture.
Key takeaways:
- Prometheus is metrics-first, cloud-native, label-driven — ideal for pipelines, services, and SLOs.
- Zabbix is infra-first, agent-based, all-in-one — ideal for classic hosts, networks, and centralized IT monitoring.
- For pure data-platform metrics (DAG success, lag, throughput), Prometheus + Grafana is usually the better fit.
- For underlying infra and network, Zabbix might be the pragmatic choice.
- Don’t be religious. Be practical. If using both solves your visibility problem, do that.
Call to action:
Pick one critical data pipeline (e.g., “daily financials”) and design 3–5 concrete metrics + alerts for it. Then try implementing them in Prometheus and (if you have it) Zabbix. After one real incident, you’ll know which stack helps you think clearly under pressure — that’s the one you should bet on.


Leave a Reply