Elastic Pools for Multi-Tenant SaaS: Sizing, Noisy Neighbor Control, and Automation
Why this matters (hook)
Your SaaS just onboarded three new enterprise customers. At 11:30 AM Eastern, usage spikes: dashboards crawl, long scans pile up, and one customer’s gnarly report starves everyone else. You’ve got two choices: wildly overprovision for peak (and burn cash) or design a pooled architecture that flexes with demand and keeps noisy neighbors in check. Let’s do the latter—properly.
What is an “Elastic Pool” in SaaS?
Elastic pool = a shared compute/storage budget for many tenant databases (or schemas) with guardrails per tenant. Think of it as a parking lot sized for the aggregate traffic, not a private garage per car.
Common incarnations:
- Azure SQL Database Elastic Pools (many DBs share vCores/eDTUs and IO)
- Postgres with Citus / Aurora / Proxy layer (tenant-per-DB or tenant-per-schema sharing a node pool)
- MySQL fleets with proxy routers (RDS/Aurora + ProxySQL/RDS Proxy)
Goal: keep overall utilization high while preventing any single tenant from degrading everyone else.
Multi-Tenant Models (quick refresher)
| Model | Isolation | Operational Overhead | Resource Efficiency | Typical Use |
|---|---|---|---|---|
| Shared schema (tenant_id column) | Low | Lowest | Highest | SMB-heavy SaaS, homogeneous workload |
| Tenant-per-schema | Medium | Medium | High | Moderate variability, simpler migrations |
| Tenant-per-database (pooled DBs) | High | Higher (more DBs) | High (with pooling) | Enterprise tenants, noisy-neighbor risk |
| Tenant-per-cluster | Very high | Highest | Low | Regulated, extreme isolation/SLAs |
Elastic pools shine for tenant-per-database (and sometimes per-schema) when you need isolation + efficiency.
Sizing an Elastic Pool (math you can defend)
Step 1 — Characterize tenant load
Gather for each tenant:
- QPS (read/write), concurrency, P95 CPU, P95 IO/throughput
- Burstiness factor (P99/P50)
- Critical windows (e.g., 8–11 AM & 1–3 PM local)
Step 2 — Aggregate with overlap
Not everyone peaks together. Compute a realistic concurrency overlap:
Effective_Pool_Capacity_needed ≈
  Σ_over_tenants (P95_CPU_i × OverlapFactor_i)  + SafetyMargin
- Start OverlapFactor at 0.4–0.7 for globally distributed tenants, 0.7–0.9 for same timezone verticals.
- SafetyMargin: 15–30% (higher if reporting jobs are unpredictable).
Step 3 — Decide per-tenant caps
Define per-tenant ceilings (CPU/IO/connections) so a single tenant cannot exceed X% of the pool. A common rule: Max 5–10% per tenant unless you label them “whale” with a separate tier or pool.
Step 4 — Set pool headroom by time
Your traffic is not uniform. Schedule capacity bands (see automation below). If you must autoscale, pick conservative steps and cooldowns to avoid thrash.
Reality check: If your top 3 tenants often exceed 40% of pool capacity together, they need their own pools (or dedicated clusters). Stop forcing them into shared.
Noisy Neighbor Control: Guardrails That Actually Work
You’ll need layered controls—one guardrail won’t save you.
1) Connection control
- Per-tenant connection limits on proxies/poolers.
- Backoff + jitter on client retries.
- Graceful “busy” responses for bursty BI tools.
Postgres example (role cap):
ALTER ROLE tenant_acme CONNECTION LIMIT 50;
2) Query governors
- Max execution time to kill runaways.
- Row/scan limits for ad-hoc endpoints.
- Statement timeouts in the session/role.
- Memory caps / work_mem per role in Postgres; per-query hints elsewhere.
Postgres timeouts:
-- Kill anything exceeding 30s for this role
ALTER ROLE tenant_acme SET statement_timeout = '30s';
-- Prevent idle-in-transaction zombies
ALTER ROLE tenant_acme SET idle_in_transaction_session_timeout = '60s';
MySQL (per-session):
SET SESSION MAX_EXECUTION_TIME=30000; -- 30s
3) Workload separation & priority
- Route OLTP and Reporting to different pools or replicas.
- Priority/queueing at the proxy (e.g., report jobs wait behind OLTP).
- Use read replicas for dashboards; throttle write-heavy jobs during peaks.
4) Rate limiting & quotas
- Requests/min per tenant at API gateway.
- Daily/Monthly compute quota for heavy tenants; burst credits if needed.
5) Storage/IO containment
- Cap per-tenant temp space; fail fast on temp bloat.
- Enforce max result size for exports (paginate instead).
Non-negotiable: OLTP must never wait behind ad-hoc analytics. Separate paths or separate pools.
Automation & Scaling Patterns
A) Schedule-based scaling (boring—and very effective)
Most SaaS usage follows the clock. Scale up during business hours, down at night/weekends.
Example — Azure CLI (conceptual):
# Scale pool compute up for peak (e.g., 7:30–19:00 on weekdays)
az sql elastic-pool update \
  --resource-group rg-saas \
  --server saas-sql \
  --name pool-core-us \
  --capacity 50  # vCores (or eDTUs, depending on model)
Automate via:
- A cron (GitHub Actions, Cloud Scheduler)
- IaC pipelines (Terraform/Bicep) with time-window variables
- Feature flag to disable scaling during incident windows
B) Event-driven autoscaling
Trigger on sustained signals (5–10 min windows), not spikes:
- CPU > 70%
- IO latency > threshold
- Connection queue depth > N
- Error rate / timeouts trending up
Use hysteresis (cooldown 15–30 min) and step changes (+/- 20%) to avoid oscillation. Always combine with per-tenant caps.
C) Pre-emption & queue drain
Before scaling, do soft shedding:
- Reject/queue low-priority queries > X ms
- Lower fetch sizes, push pagination
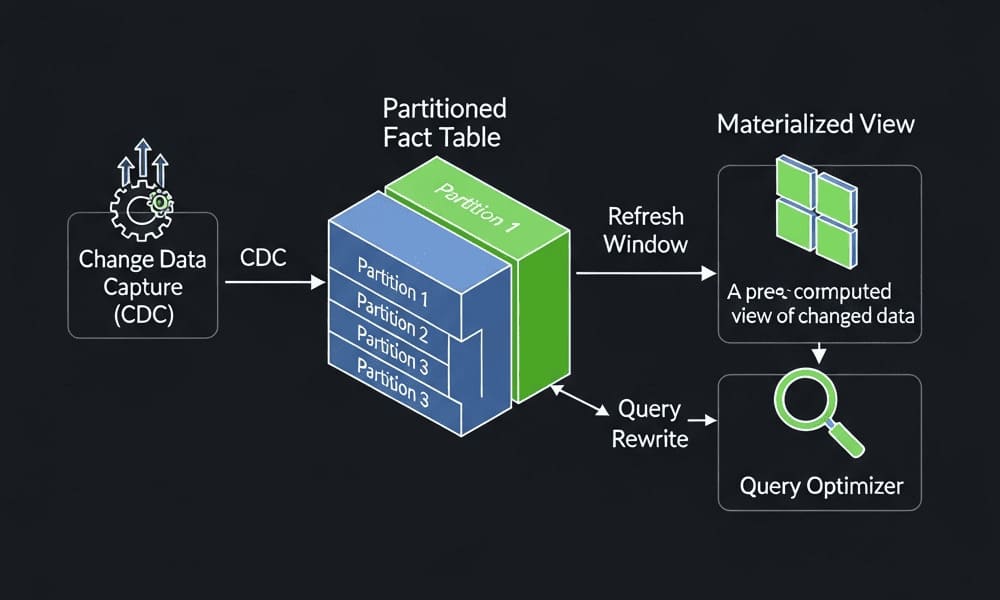
- Switch heavy reports to materialized views or pre-aggregations
D) Cost guardrails
- Daily budget alerts tied to pool capacity changes
- Tag pools by environment/region; auto-report $/tenant/day
- If cost/tenant > plan price, move them up a tier or to a dedicated pool
Reference Architecture (textual)
- API Gateway / Rate Limiter → App
↳ routes OLTP → Primary Pool (elastic)
↳ routes BI/Reports → Read Replica Pool (elastic) - Proxy/Pooler (conn limits, priority queues)
- Elastic Pools (per region) with per-DB caps
- Observability: SQL telemetry, queue depth, P95 latency, error budgets
- Scaler: schedule + event-driven controller with hysteresis
- Data Products: materialized views, nightly rollups to storage/warehouse
Query Governor Patterns (copy/paste ready)
Kill long queries safely
Postgres (cron):
SELECT pg_terminate_backend(pid)
FROM pg_stat_activity
WHERE usename LIKE 'tenant_%'
  AND state = 'active'
  AND now() - query_start > interval '45 seconds';
Force pagination
- API response hard-limit (e.g., 10k rows), return
next_page_token - DB layer:
LIMIT/OFFSETor keyset pagination:
SELECT * FROM events
WHERE tenant_id = $1 AND (ts, id) > ($cursor_ts, $cursor_id)
ORDER BY ts, id
LIMIT 1000;
Protect OLTP
- Put heavy reports on replicas (logical/physical)
- For complex aggregates, precompute into summary tables every 5–10 minutes
Best Practices & Pitfalls
Best Practices
- Right-size with data: use P95, not averages; model overlap.
- Tier your tenants: whales get their own pool or higher caps; SMBs share.
- Separate workloads: OLTP vs analytics → different pools/replicas.
- Govern at multiple layers: API → proxy → DB → query.
- Automate safely: schedule first, then guarded autoscale.
- Make cost visible: attribute pool spend per tenant.
Pitfalls
- One big pool for everything → guarantees contention.
- Autoscale without caps → one tenant triggers runaway scaling.
- Relying on human ops during peak → you’ll always be late.
- Letting BI tools hit primaries → death by full scans.
- No timeouts → zombie sessions hoard resources.
Real-World Scenario (numbers you can sanity-check)
- 600 tenants, US-centric, peaks at 9–11 AM and 2–4 PM ET
- Typical tenant P95 ≈ 0.15 vCPU, bursty factor 1.6
- Overlap factor during peaks: 0.65
- Pool target:
600 × 0.15 × 0.65 × 1.6 ≈ 93 vCPU - Add 25% safety → ~116 vCPU peak capacity
- Off-peak scale to 40 vCPU (cheap)
- Top 5 tenants consume >35% at peak → move to two separate pools
- Result: P95 latency -45%, compute bill -28% vs fixed 120 vCPU 24/7
Internal link ideas (add these on your blog)
- “Sharding Strategies 101: Range vs Hash vs Directory”
- “Tenant Isolation Models: Shared, Schema, Database, Cluster”
- “Read Replicas Done Right: Serving BI Without Hurting OLTP”
- “Query Governors: Timeouts, Pagination, and Backpressure Recipes”
- “Cost Attribution in SaaS: Tagging and $/Tenant Dashboards”
Conclusion & Takeaways
Elastic pools let you buy capacity once and sell it many times—if you combine sound sizing with ruthless guardrails.
Remember:
- Size with P95 + overlap, not vibes.
- Cap tenants and separate workloads to neuter noisy neighbors.
- Prefer schedule-based scaling; layer event-driven autoscale with hysteresis.
- Instrument cost and performance per tenant; upgrade whales or isolate them.
Call to action:
Want a review of your tenant model, pool caps, and scaling rules? Share your current metrics (P95 CPU/IO, concurrency, overlap assumptions), and I’ll propose a concrete pool plan with guardrails you can ship this week.
Image prompt
“A clean, modern architecture diagram of a multi-tenant SaaS using elastic pools: API gateway and rate limiter, proxy with connection limits, separate OLTP and reporting paths, two elastic pools with per-tenant caps, read replicas, and an autoscaling controller with schedule and event triggers — minimalistic, high contrast, isometric 3D style.”
Tags
#SaaS #MultiTenant #ElasticPools #DatabaseScaling #NoisyNeighbor #QueryGovernors #DataEngineering #PostgreSQL #AzureSQL #Architecture



Leave a Reply