Snowflake Performance Tuning: From Micro-Partitions to Pruning
Concrete steps to make queries faster without heroics
Introduction — why this matters
Your Snowflake spend isn’t dominated by exotic ML or “clever” SQL. It’s crushed by everyday queries that scan way too much data, spill to remote storage, and run on warehouses that are either oversized or misused. The good news: you can get 80–90% of the wins by understanding micro-partitions, pruning, clustering, caching, and explain plans—then applying a handful of disciplined steps.
This is a practical guide. No silver bullets. Just specific, repeatable moves.
The mental model (in 60 seconds)
- Storage: Snowflake stores table data in immutable micro-partitions (~16MB compressed), each tagged with rich metadata (min/max per column, null counts, bloom-like stats, etc.).
- Compute: Warehouses pull the micro-partitions they need. If your predicates align with the metadata, Snowflake prunes away massive chunks before scan.
- Optimization levers:
- Shape data so pruning works (clustering keys, partition-friendly load).
- Write queries that can prune (sargable predicates).
- Use caches intelligently (result/metadata/local).
- Verify with EXPLAIN and the Query Profile.
Quick wins checklist (prioritized)
- Make predicates sargable (no functions on columns in WHERE/JOIN).
- Constrain by high-selectivity columns early (date ranges, tenant_id, status).
- Cluster large hot tables on the columns you actually filter by.
- Avoid massive
SELECT *; project only needed columns. - Use
QUALIFYover nested windows to reduce data early. - Exploit result cache by keeping query text stable and deterministic.
- Right-size warehouses (bigger isn’t always faster—watch spill).
- Measure with
EXPLAIN USING TEXT, Query Profile, and clustering depth.
Micro-partitions & pruning — what to target
Goal: maximize partitions scanned / total partitions as close to 0 as possible.
How pruning works
Snowflake reads partition metadata first. If your filter is event_ts BETWEEN '2025-11-01' AND '2025-11-07' AND customer_id = 42, and those values are well-localized in certain partitions, Snowflake skips the rest. If your filter is DATE(event_ts) = '2025-11-05', you just killed pruning—Snowflake must compute DATE(event_ts) for every row.
Make queries prune-friendly (examples)
Bad (non-sargable):
-- Function on column blocks partition pruning
WHERE DATE(event_ts) = '2025-11-05'
Good (sargable):
WHERE event_ts >= '2025-11-05'::timestamp_ntz
  AND event_ts <  '2025-11-06'::timestamp_ntz
Bad:
-- Implicit casts/expressions on the left side
WHERE to_varchar(tenant_id) = '123'
Good:
WHERE tenant_id = 123
Bad:
-- Wildcards at the left kill search
WHERE email LIKE '%@example.com'
Better:
-- Store domain in a separate column or use Search Optimization if needed
WHERE email_domain = 'example.com'
Clustering keys — when and how to use
When: Tables > 100–200 GB that serve frequent, selective filters on specific columns (dates, tenant/account keys, high-selectivity flags).
What: CLUSTER BY defines expressions that Snowflake tries to co-locate within partitions. This increases pruning hit-rates.
Create or change clustering:
ALTER TABLE fact_orders
CLUSTER BY (to_date(order_ts), customer_id);
Assess clustering depth (how well-co-located data is):
SELECT
  t.$1:average_overlaps::float AS avg_overlaps,
  t.$1:partitions_total::int   AS partitions_total
FROM TABLE(
  SYSTEM$CLUSTERING_INFORMATION('FACT_ORDERS', '(TO_DATE(ORDER_TS), CUSTOMER_ID)')
) AS t;
- avg_overlaps ~ 1–3 → healthy.
- >> 10 → consider reclustering (or you picked the wrong keys).
Trigger manual reclustering (only if needed):
ALTER TABLE fact_orders RECLUSTER;
Pitfalls
- Clustering keys that don’t match real predicates add cost with little benefit.
- Over-clustering (many expressions) increases maintenance overhead. Start with 1–2.
Search Optimization (for needles in haystacks)
For point lookups on high-cardinality text/JSON fields (e.g., user_id embedded in VARIANT, email, GUIDs) where regular clustering can’t help:
ALTER TABLE events ADD SEARCH OPTIMIZATION ON EQUALITY(user_id), SUBSTRING(email);
Use sparingly—it consumes storage and adds write cost, but it can turn seconds into milliseconds for pinpoint filters.
Explain plans & Query Profile — read them like an engineer
Text plan (fast sanity check):
EXPLAIN USING TEXT
SELECT ...
Look for:
- Pruning ratio in Profile (UI): “Partitions scanned” vs “Total”.
- Bytes scanned: if it’s near table size, you’re not pruning.
- Spill to remote: indicates warehouse is too small or query too wide.
- Join order: ensure high-selectivity table is the build side when appropriate.
Query history / profile via SQL:
SELECT query_id, start_time, total_elapsed_time, bytes_scanned, partitions_scanned, partitions_total
FROM TABLE(INFORMATION_SCHEMA.QUERY_HISTORY(RESULT_LIMIT=>50))
WHERE query_text ILIKE '%FROM FACT_ORDERS%'
ORDER BY start_time DESC;
Operator stats (join/hash/spill clues):
SELECT *
FROM TABLE(INFORMATION_SCHEMA.QUERY_HISTORY_BY_SESSION())
WHERE query_id = '01b3f...';  -- then inspect in UI for spills, repartitions
Caching — free speed if you don’t fight it
Snowflake has three caches:
| Cache | What it stores | How to benefit | Gotchas |
|---|---|---|---|
| Result cache | Final result sets (24h) | Keep query text stable, avoid nondeterministic functions (CURRENT_TIMESTAMP()) | Different role/warehouse/session parameters can invalidate |
| Local disk cache | Data micro-partitions on the warehouse nodes | Re-run similar queries on the same warm warehouse | Scales to zero on suspend; different warehouse = cold |
| Metadata cache | Table stats, file lists, partition metadata | Favor pruning-friendly predicates; avoid frequent DDL churn | Heavy DDL can evict or stale metadata briefly |
Tip: Wrap time filters without volatile functions:
SET start_ts = '2025-11-01'::timestamp_ntz;
SET end_ts   = '2025-12-01'::timestamp_ntz;

SELECT ...
WHERE event_ts >= $start_ts AND event_ts < $end_ts;
Same text + same binds = better result-cache hits.
Warehouse sizing — speed vs spill
- Start small, scale up only if you see spill. Check the Profile for “Remote Disk Spill.”
- More cores ≠ linear speedup if you’re I/O bound or not pruning. Fix pruning first.
- Multi-cluster helps concurrency, not single-query latency.
Concrete tuning steps (do these in order)
- Find fat queries.
SELECT query_id, total_elapsed_time/1000 AS sec, bytes_scanned/1e9 AS gb
FROM TABLE(INFORMATION_SCHEMA.QUERY_HISTORY(RESULT_LIMIT=>200))
WHERE bytes_scanned > 50e9
ORDER BY bytes_scanned DESC;
- Make the filter sargable. Remove functions on columns; turn
DATE(col)into range filters. - Project less. Replace
SELECT *with explicit columns. - Check pruning. Run once, open Query Profile. If partitions scanned / total > 0.2, keep going.
- Add/adjust clustering key on the hottest large table to match real filters. Re-run and re-check pruning.
- Eliminate spills. If pruning’s good but you still spill, bump warehouse one size and re-test.
- Stabilize text for caching. Parameterize dates, remove
CURRENT_DATE()from the text. - Consider Search Optimization for pinpoint filters on high-cardinality text/JSON.
- Materialize if it’s always the same. Materialized views on heavy aggregates with stable filters.
- Automate checks. Alert on “bytes_scanned per row returned,” “pruning ratio,” and “remote spill events.”
Real example — turning a 90s query into 6s
Before:
SELECT *
FROM fact_events
WHERE DATE(event_ts) = CURRENT_DATE() - 1
  AND tenant_id = 42;
- Non-sargable date filter → almost no pruning.
SELECT *→ wide scan.- Spilled to remote on
Mwarehouse.
After:
-- 1) Stabilize time range
SET d = (CURRENT_DATE() - 1)::date;

-- 2) Narrow projection + sargable predicates
SELECT tenant_id, event_ts, event_type, amount
FROM fact_events
WHERE event_ts >= $d::timestamp_ntz
  AND event_ts <  ($d + 1)::timestamp_ntz
  AND tenant_id = 42;

-- 3) Align data layout with usage
ALTER TABLE fact_events CLUSTER BY (to_date(event_ts), tenant_id);
Result:
- Partitions scanned dropped from ~85% → <5%.
- Bytes scanned down ~20×.
- No spill on same warehouse size.
- Stable text yields frequent result-cache hits in BI.
Best practices & common pitfalls
Do
- Design tables so hot predicates are first-class columns (don’t fish inside VARIANT during filters).
- Use bucketing dates (
to_date(ts)) for clustering expressions; filter on timestamp ranges. - Keep query text stable for cache hits (bind variables; no volatile functions in text).
- Measure everything—don’t guess. Save before/after metrics.
Don’t
- Don’t assume bigger warehouse = faster. Fix pruning first.
- Don’t overuse clustering—choose 1–2 expressions that reflect real filter patterns.
- Don’t
SELECT *in production analytics. - Don’t wrap indexed/filter columns with functions in WHERE/JOIN.
- Don’t churn DDL on hot tables during business hours—hurts metadata cache.
Comparison table — when to use which lever
| Situation | Best lever | Why |
|---|---|---|
| Wide scans with simple date filters | Sargable ranges + cluster by to_date(ts) | Maximizes partition pruning |
| Point lookup on high-cardinality text | Search Optimization | Index-like access path |
| Big scans but still spilling | One-size up warehouse | More memory for joins/hash/aggregation |
| Repeated identical dashboards | Result cache | 0-compute repeated answers |
Semi-structured filters (VARIANT) | Extract to columns or use SEARCH OPTIMIZATION on path | Enables pruning |
Internal link ideas (for your site)
- Designing Sargable SQL in Snowflake
- Choosing Effective Clustering Keys (with real workloads)
- Search Optimization vs Materialized Views
- Warehouse Sizing: Cost–Latency Playbook
- From VARIANT to Columns: Modeling Semi-Structured Data
Conclusion + Takeaways
Snowflake is fast when you let it prune. Most “slow query” tickets trace back to non-sargable predicates, SELECT *, and data that isn’t clustered along real filters. Fix pruning first, size compute second, and always confirm with EXPLAIN and the Query Profile. Do this ruthlessly for your top 20 queries and you’ll cut runtime and cost without heroics.
Call to action: Pick your heaviest dashboard query today. Apply the 10-step sequence. Capture the before/after numbers. Then templatize it for the rest of your lakehouse.
Image prompt
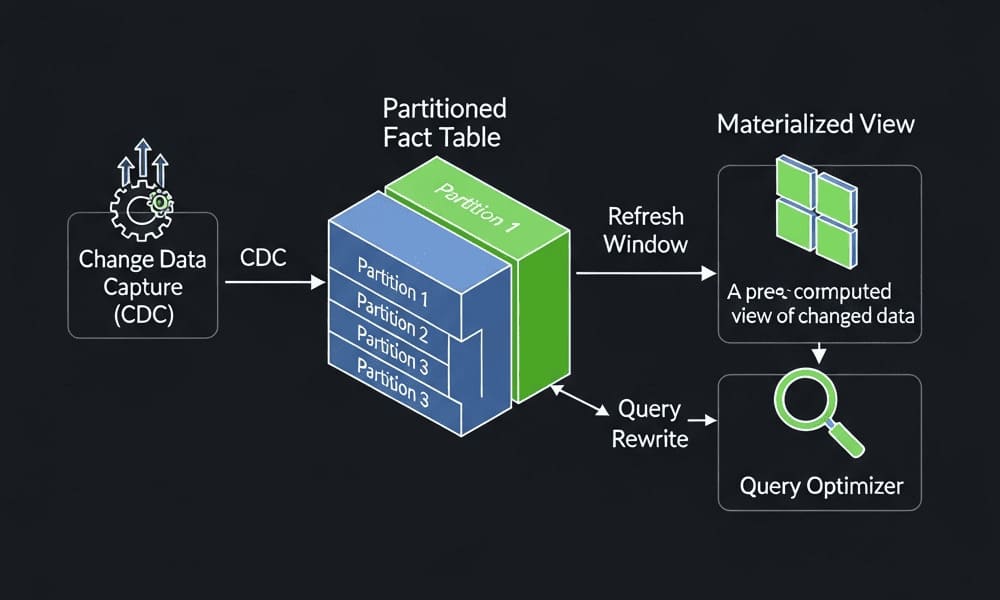
“A clean, modern Snowflake performance diagram showing micro-partitions, pruning, clustering keys, and caches. Minimalistic, high-contrast, isometric style with labeled data flows and pruning percentages.”
Tags
#Snowflake #PerformanceTuning #MicroPartitions #Pruning #Clustering #QueryOptimization #DataEngineering #CloudDataWarehouse #SQL #Caching





Leave a Reply